

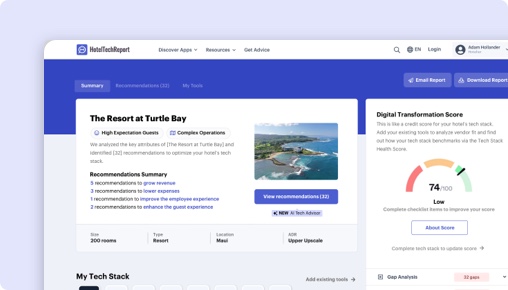
抱歉,此功能仅向已认证的酒店从业者开放
项目面板是一款免费工具,仅向已认证的酒店从业者开放。它通过简化调研流程和沟通环节,让采用新技术变得更轻松。

Juyo 对比 Optimand:按酒店细分市场排名
各产品在不同酒店规模、类型和区域的 商业智能 供应商中的排名——基于各细分市场中酒店经营者的经验证评价。
按酒店规模
| 细分市场 |
 Juyo |
 Optimand |
|---|---|---|
| 小型(10-24 间客房) ▾ | #21 1 条评价 | #6 11 条评价 |
| 中型(25-74 间客房) ▾ | #17 13 条评价 | #16 10 条评价 |
| 大型(75-199 间客房) ▾ | #11 13 条评价 | #14 7 条评价 |
| 超大型(200+ 间客房) ▾ | #7 7 条评价 | #16 2 条评价 |
按酒店类型
| 细分市场 |
Juyo
|
Optimand
|
|---|---|---|
| 精品酒店 ▾ | #16 19 条评价 | #7 20 条评价 |
| 豪华酒店 ▾ | #17 10 条评价 | #10 18 条评价 |
| 品牌/连锁酒店 ▾ | #13 20 条评价 | #17 6 条评价 |
| 长住酒店 | — | #10 4 条评价 |
按区域
| 细分市场 |
Juyo
|
Optimand
|
|---|---|---|
| 北美 | #11 4 条评价 | #14 1 条评价 |
| 欧洲 ▾ | #8 30 条评价 | #6 28 条评价 |
Is Juyo or Optimand Better for Hotels?
Juyo and Optimand both serve as advanced business intelligence platforms designed to unify hotel performance data, but they diverge significantly in operational focus and user experience. Juyo excels at integrating diverse hotel data streams—including revenue, finance, F&B, and M&E—into a consolidated dashboard enhanced by AI-driven guidance, making it ideal for hotels that require deep multi-departmental insights and automated cost tracking. Optimand focuses on real-time market analytics, website behavior, direct booking optimization, and dynamic pricing, serving hotels that prioritize nimble revenue strategy adjustments and direct channel growth.
Both products address the critical hotel challenge of making sense of scattered data to improve revenue management and commercial decision-making. By consolidating data from various sources into actionable dashboards, they help revenue managers and executives accelerate informed decisions that drive profitability. However, they cater to different operational needs: Juyo emphasizes comprehensive internal data integration and cost analytics, while Optimand delivers fast, market-facing intelligence and tools designed to enhance direct bookings.
Juyo vs Optimand: Which Should Your Hotel Choose?
If your hotel operates with complex, multi-departmental data needs—combining commercial, F&B, finance, and events metrics—and you value AI-powered insights and automated distribution cost analytics, Juyo is the stronger choice. This is supported by 34 reviews emphasizing Juyo’s ability to integrate various internal data sources into a single dashboard and its unique Distribution Cost module, which streamlines cost tracking and Net RevPAR calculations. Boutique and branded hotels, which make up 49% of Juyo’s user base with ratings averaging 4.6 to 4.7/5, reflect that this platform fits properties managing diverse revenue streams.
Conversely, if your primary focus is driving direct bookings, understanding website demand in real time, and adjusting pricing dynamically to market shifts, Optimand stands out. Its 30 reviews highlight real-time data speed, actionable market insights, and tools for targeted promotions that boost brand.com conversions. Hotels in luxury, boutique, and resort segments—accounting for 66% of Optimand’s users and rating the product consistently at 4.9 to 5/5—value its ability to analyze booking pace by rate code and competitor pricing. However, data for extended stay and limited service segments is limited or absent, so suitability there is less certain.
Is Juyo or Optimand Easier to Use?
Optimand holds a clear edge in ease of use and onboarding, scoring a perfect 5/5 in both categories compared to Juyo’s solid 4.6/5 ratings. Reviewers praise Optimand for its intuitive interface and the speed with which data loads, enabling users to make decisions quickly. Although some mention the platform’s many data screens can be initially overwhelming, the team’s responsiveness in implementing user suggestions has improved navigability. Juyo users find the interface visually helpful for fast decision-making but note that complexity in modules like forecasting and pricing setup requires more user education. The lack of automatic forecast features also adds friction to usability.
Edge: Optimand.
Which Has Better Features: Juyo or Optimand?
Juyo offers five unique features that are highly relevant operationally: Sales Team Productivity Tracking, Open API, Distribution Cost Analytics, Version Control, and Collaboration & Commenting. Distribution Cost Analytics, praised as a “game changer” in reviews, automates channel cost calculations and yield per segment metrics, allowing revenue and commercial teams to shift focus from data prep to strategy. Collaboration tools enable cross-departmental communication within the platform, enhancing decision workflow in hotels managing multiple revenue centers.
Optimand has one exclusive feature: an Alerts Feed that delivers real-time notifications, helping teams quickly respond to market changes. While useful, it does not match Juyo’s depth in internal analytics and collaboration capabilities. Both platforms share 25 features, covering core BI and reporting needs.
Edge: Juyo.
Which Has Better Customer Support: Juyo or Optimand?
Optimand slightly outperforms Juyo in customer support and onboarding ratings, scoring 5/5 versus Juyo’s 4.8/5, reflecting high satisfaction among users. Juyo reviewers frequently commend the support team’s professionalism and openness to incorporating feedback, noting rapid implementation of requested improvements. Optimand users report an agile support team that continuously upgrades the platform based on suggestions, emphasizing responsiveness and partnership.
Though both platforms offer strong support, Optimand’s perfect scores and user comments about ongoing rapid improvements give it a narrow advantage.
Edge: Optimand.
Which Has More Integrations: Juyo or Optimand?
Juyo connects with 16 verified partners, more than double Optimand’s 7. Shared integrations include key PMS and hospitality systems such as Stayntouch, Oracle Hospitality, and Mews. Juyo’s broader integration list includes industry staples like Fairmas, STR, TravelClick, Revinate, and Amadeus, which are critical for hotels requiring comprehensive market benchmarking and distribution connectivity.
Optimand’s unique integrations, including Simple Booking and IDeaS, are more specialized but fewer in number. Hotels relying on extensive external data sources and legacy systems will benefit more from Juyo’s wider partner network.
Edge: Juyo.
Which Do Hoteliers Rate Higher: Juyo or Optimand?
Optimand leads with an overall rating of 4.9/5 across 30 reviews, compared to Juyo’s 4.6/5 from 34 reviews. Both have no reviews in the last six months, so ratings reflect stable performance. Optimand’s likelihood to recommend is 98%, exceeding Juyo’s 93%. Segment ratings show Optimand scoring 4.9 to 5/5 in luxury, boutique, city center, and resorts, whereas Juyo scores 4.6 to 4.9/5 in boutique, branded, and luxury hotels but dips in airport/conference hotels (4.2) and limited service (4.2).
The higher ratings and recommendation likelihood, combined with consistent top scores across multiple hotel types, indicate stronger user satisfaction for Optimand.
Edge: Optimand.
How Much Do Juyo and Optimand Cost?
Both Juyo and Optimand have the same base price of $200.00, with no freemium version, no monthly flat fees, no per-room pricing, and no implementation fees. Neither offers a trial period. This parity simplifies cost comparison, shifting the decision to feature fit and operational impact rather than price differences.
What Type of Hotel Should Use Juyo?
- Hotels that need multi-source data integration across revenue, finance, F&B, and M&E, as supported by Juyo’s capability to unify commercial and operational data.
- Teams focused on distribution cost control and yield analysis via Juyo’s unique Distribution Cost Analytics.
- Properties valuing AI-powered insights and next-step guidance through Juyo’s Kassandra AI.
- Branded and boutique hotels with complex data environments and demand for collaboration tools.
- Hotels that require extensive third-party integrations for market benchmarking and reporting.
Not ideal if:
- Your team needs real-time forecasting and rapid market-responsive pricing adjustments; Juyo’s forecasting automation is still developing.
- Simplicity and rapid onboarding are priorities; some users find Juyo’s interface complex and training-intensive.
- You require a trial period or flexible pricing models.
What Type of Hotel Should Use Optimand?
- Hotels prioritizing real-time market analytics, booking engine demand insights, and competitor rate tracking.
- Properties aiming to increase direct bookings and reduce OTA dependence using Optimand’s targeted promotion tools.
- Luxury, boutique, resort, and city center hotels that rate Optimand highly and benefit from its data speed and customization.
- Revenue teams seeking an intuitive platform with fast data load times and actionable alerts.
- Hotels wanting to leverage website analytics integrated with booking engine performance.
Not ideal if:
- You need extensive integration with multiple legacy systems or comprehensive internal data consolidation; Optimand has fewer verified partners.
- You require complex cross-departmental collaboration features within your BI system.
- Your property demands automated forecasting modules beyond current capabilities.
Juyo vs Optimand: The Bottom Line for Hotels
Juyo and Optimand both address the hotel industry’s need to convert fragmented data into actionable intelligence but differ in scope and operational focus. Juyo delivers a comprehensive AI-powered analytics platform that integrates diverse internal and external data sources, automates distribution cost monitoring, and supports collaboration. Optimand provides real-time, market-facing BI with emphasis on direct booking growth, dynamic pricing, and website analytics.
Choose Juyo if your hotel manages complex data from multiple departments and values AI-driven insights, especially for distribution cost control and multi-source integration. Juyo’s five unique features and extensive partnerships reflect this strength. Choose Optimand if your property prioritizes immediate market intelligence, fast decision-making, and direct booking strategies, benefiting from its superior ease of use, customer support, and higher overall ratings.
Edge calls favor Optimand in ease of use, customer support, and overall rating, while Juyo leads in feature differentiation and integration breadth. The decision depends on whether your hotel needs comprehensive internal data integration with AI support (Juyo) or a market-responsive, user-friendly platform focused on direct revenue growth (Optimand).
功能对比:Juyo 与 Optimand
这些是每个供应商配置的功能,按功能组进行整理——与供应商后台中显示的数据相同。展开任意功能组即可并排比较功能。
| 功能 |
Juyo
|
Optimand
|
|---|---|---|
|
▾
分析
|
|
|
| 自定义报告和模板 | ||
| 净收入关键绩效指标 | ||
| 其他收入预测、报告与分析 | ||
| 餐饮报告、分析与预测 | ||
| 企业及旅行社账户跟踪 | ||
| 分析仪表盘 | ||
| 销售团队生产力跟踪 | ||
| 收入节奏 | ||
| 仪表盘与数据可视化 | ||
| 分销成本分析 | ||
| 定期报告 | ||
| 多酒店及组合层级跟踪 | ||
| 定价决策影响跟踪 | ||
| 客户盈利贡献 | ||
| 共享需求日历 | ||
| 灵活的组合分组 | ||
| 人工智能 | ||
|
▾
预测、预算与规划
|
|
|
| 收入节奏 | ||
| 预测锁定与工作流程 | ||
| 基于驱动因素的模型 | ||
| 餐饮报告、分析与预测 | ||
| 其他收入预测、报告与分析 | ||
| 商业与营销计划 | ||
| 版本控制 | ||
| 基于网页 | ||
| 定价决策影响跟踪 | ||
| 共享需求日历 | ||
| 灵活的组合分组 | ||
|
▾
数据管理
|
|
|
| 多酒店管理 | ||
| 集中式用户与角色管理 | ||
| 开放API | ||
| 自动化数据收集与集成 | ||
| 可定制的数据层级 | ||
| 应用内数据管理 | ||
| 灵活的组合分组 | ||
|
▾
协作
|
|
|
| 协作与评论 | ||
| 可共享的模板和计划 | ||
| 文件附件 | ||
| 基于网页 | ||
| 警报推送 |
Juyo 对比 Optimand:总结
酒店经营者喜爱的方面
用户强调 Juyo 有效的预测能力及其通过详细分析和战略制定帮助优化收入的能力。一些用户还建议改进更复杂的预测功能。
评论者对 Juyo 将各种数据源(例如 PMS、费率购物和 CRM 数据)集成到综合仪表板中的能力表示赞赏,该仪表板有助于战略决策并简化日常运营。
Juyo 直观且用户友好的界面是酒店经营者强调的一大优势,使其易于导航并有效利用不同的模块。
酒店经营者提出异议的方面
尽管反馈积极,但一些用户仍指出了需要改进的具体领域,例如更详细的预测模块、对某些数据的更好概览以及用户友好设计的增强。
一些用户提到,虽然安装过程可能很耗时,但他们认为,由于 Juyo 在完全配置后提供的广泛功能和优势,这种努力是值得的。
排名更高的方面
独特功能
酒店经营者喜爱的方面
实时数据可用性因能够快速做出数据驱动的决策而受到称赞。用户欣赏前瞻性数据,这让他们能够预测市场趋势和竞争对手的定价变化。这方面被视为制定战略酒店方法的... 实时数据可用性因能够快速做出数据驱动的决策而受到称赞。用户欣赏前瞻性数据,这让他们能够预测市场趋势和竞争对手的定价变化。这方面被视为制定战略酒店方法的关键。
Optimand 擅长制定和完善收入策略。其工具有助于动态管理定价并发现市场增长机会。这一主题被强调为一项关键优势,可确保酒店持续保持竞争优势和盈利能力。
该产品有助于全面分析市场需求,促进决策过程。用户欣赏能够利用竞争对手定价和市场趋势数据,支持最佳费率设置和战略规划的能力。
排名更高的方面
独特功能
评分差异最大的方面
关于 Juyo 与 Optimand 的常见问题
Juyo 能否替代 Optimand?
这取决于您的需求。Juyo 和 Optimand 共享许多核心 Business Intelligence 功能,但各有独特的能力。Juyo 提供 16 个经验证的集成合作伙伴,而 Optimand 提供 7 个。在切换之前,请查看上方的功能对比以了解它们的差异。
哪个更适合小型或独立酒店?
小型酒店应优先考虑易用性和快速上手。Optimand 在易用性方面领先,评分为 5.0/5 对比 4.6/5。寻找透明定价以及试用或演示选项。在各产品页面上按酒店规模筛选评价,了解与您类似的酒店的反馈。
Juyo 或 Optimand 是否提供免费方案?
Juyo:否。Optimand:否。 两款产品目前均不提供免费版。大多数 Business Intelligence 供应商提供演示或试用——在做出承诺之前,请分别向各供应商申请体验。
HTR 如何评估和排名 Juyo 和 Optimand?
HT Score 是一个综合排名,考虑 4 个标准组和十多个变量,帮助酒店经营者客观比较酒店科技产品。Juyo 的 HT Score 为 24,Optimand 的为 25。以下是评分的计算方式。
| 标准组 | 权重 | 衡量内容 |
|---|---|---|
| 客户评分与评价 |
|
用户对该产品的推荐度如何? 评分分数、评价数量、声量份额、评价深度、评价时效性、成功案例 ▾ 权重最高的因素。分析平均满意度评分(推荐可能性、易用性、支持、投资回报率)、相对于同类产品的评价总数、评价时效性(最近 6 个月内至少 20 条评价)以及跨独立酒店客户的声量份额以检测选择偏差。 |
| 合作伙伴生态系统 |
|
技术合作伙伴对该公司的推荐度如何? 合作伙伴推荐、集成数量、集成质量 ▾ 评估合作伙伴推荐作为专家信心投票、经验证集成的数量以及生态系统质量——集成合作伙伴的平均 HT Score。拥有更高质量集成生态系统的产品更有可能提供互联互通的技术栈。 |
| 以客户为中心 |
|
该组织以客户为中心的程度如何? 认证支持、评价一致性、资料完整性 ▾ 评估公司是否获得 HTR 客户支持认证、是否保持持续的评价收集(反馈驱动文化的指标)以及产品资料是否完整,包括功能、截图、定价和特性。 |
| 覆盖范围、持久力与资源 |
|
该公司的覆盖范围和资源有多广泛? 地理覆盖、持久力、公司资源、趋势评分 ▾ 衡量全球覆盖(服务的国家和区域)、经营年限作为稳定性指标、团队规模作为资源指标,以及基于近十二个月买家咨询、评价、合作伙伴推荐和媒体活动的趋势评分。 |
客户评分和评价是 HT Score 算法中最重要的因素。HTR 不接受付费以提高排名。所有评价均经过验证——只有经确认从属关系的酒店行业从业者才能提交评分。 查看完整 HT Score 评估方法 →
酒店经营者还在阅读哪些 商业智能 对比?
探索更多基于经验证酒店经营者评价的一对一对比。





获取您的免费人工智能分析师报告
根据您酒店的情况量身定制的推荐


