

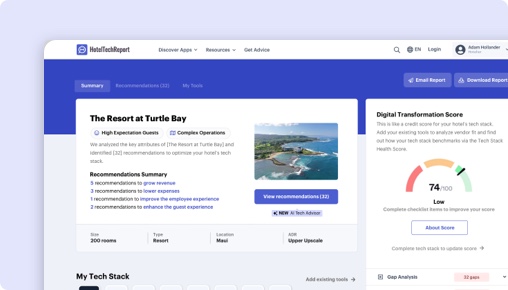
Sorry, deze functionaliteit is alleen beschikbaar voor geverifieerde hoteliers
Het projectdashboard is een gratis tool dat alleen beschikbaar is voor geverifieerde hoteliers. Het maakt het invoeren van nieuwe technologie eenvoudiger door hun onderzoek te stroomlijnen en hun communicatie te vereenvoudigen.

M3 (Insight) vs. Thynk Business Intelligence:
Welke past bij u?
Samenvatting
We hebben 338 geverifieerde hotelierbeoordelingen geanalyseerd, functiesets, prijzen en praktijkcasestudies vergeleken om te bepalen waar elk platform uitblinkt. De juiste keuze hangt af van uw hoteltype en prioriteiten:
M3 blinkt uit in business intelligence dashboards en beslissingsondersteuning — vooral voor bed-&-breakfast-accommodaties (4,6/5), met exclusieve functies zoals Dagelijkse rapportage en Financiële rapportage.
Hoe verhoudt M3 (Insight) zich tot Thynk Business Intelligence?
Zij-aan-zij beoordelingen op basis van 338 geverifieerde hotelierbeoordelingen op HTR.
| HTScore |
|
|
| Waarschijnlijkheid om aan te bevelen |
|
|
| Gebruiksgemak |
|
|
| Klantenondersteuning |
|
|
| Prijs-kwaliteitverhouding |
|
|
| Vanafprijs | Vanaf $300/mnd | Vanaf $600/mnd |
| Geverifieerde beoordelingen | 330 | 8 |
Wat zijn de voor- en nadelen van M3 (Insight) vs Thynk Business Intelligence?
Na analyse van 338 geverifieerde beoordelingen waarderen M3-gebruikers vooral de business intelligence dashboards en beslissingsondersteuning, automatisering van boekhouding en minder handmatige codering, gebruiksgemak en navigatie, terwijl Thynk-gebruikers de benadrukken. Klik op een thema om te zien wat beoordelaars zeggen.
|
M3
|
Thynk
|
|---|---|
| Voordelen | |
|
+
Business intelligence dashboards en beslissingsondersteuning
▾
|
|
|
+
Automatisering van boekhouding en minder handmatige codering
▾
|
|
|
+
Gebruiksgemak en navigatie
▾
|
|
|
+
Realtime factuur- en data-integratie
▾
|
|
| Nadelen | |
|
−
Financiële rapportage en grootboekcodering
▾
|
|
|
−
Reactiesnelheid van support en opvolging van cases
▾
|
|
|
−
Beperkingen in rapportaanpassing en rapportontwerper
▾
|
|
M3 vs Thynk: Ranglijst per hotelsegment
Hoe elk product scoort onder Business Intelligence-leveranciers voor verschillende accommodatiegroottes, hoteltypen en regio's — op basis van geverifieerde beoordelingen van hoteliers in elk segment.
Op hotelgrootte
| Segment |
M3
|
Thynk
|
|---|---|---|
| Klein (10-24 kamers) ▾ | #7 13 beoordelingen | #25 0 beoordelingen |
| Middelgroot (25-74 kamers) ▾ | #3 171 beoordelingen | #21 3 beoordelingen |
| Groot (75-199 kamers) ▾ | #4 46 beoordelingen | #18 1 beoordelingen |
| Extra groot (200+ kamers) ▾ | #5 19 beoordelingen | #17 1 beoordelingen |
Op hoteltype
| Segment |
M3
|
Thynk
|
|---|---|---|
| Boutique ▾ | #4 112 beoordelingen | #22 2 beoordelingen |
| Luxe ▾ | #4 57 beoordelingen | #19 3 beoordelingen |
| Merk / Keten ▾ | #3 191 beoordelingen | #22 2 beoordelingen |
| Langverblijf ▾ | #3 30 beoordelingen | #25 0 beoordelingen |
Op regio
| Segment |
M3
|
Thynk
|
|---|---|---|
| Noord-Amerika ▾ | #2 248 beoordelingen | #25 0 beoordelingen |
| Europa | #24 2 beoordelingen | #16 4 beoordelingen |
| Azië-Pacific ▾ | #16 5 beoordelingen | — |
| Midden-Oosten | — | #10 1 beoordelingen |
Is M3 (Insight) or Thynk Business Intelligence Better for Hotels?
M3 Insight and Thynk Business Intelligence both address the need for hotel business intelligence but serve distinct operational priorities and property types. M3 Insight excels as a comprehensive financial and operational analytics platform built around accounting, budgeting, and forecasting workflows, integrating with multiple hotel systems to automate data gathering and reporting. Thynk focuses primarily on commercial analytics, built on Salesforce CRM Analytics, targeting hotel sales and revenue teams with dashboards that surface actionable insights for multi-property portfolio management.
M3 is better suited to hotels seeking deep financial integration and automated accounting workflows, while Thynk fits commercial teams needing real-time revenue intelligence across hotel portfolios. Both products solve the problem of fragmented hotel data delaying decision-making by centralizing data into accessible dashboards, but M3 emphasizes operational cost control and budgeting, whereas Thynk prioritizes sales performance and revenue optimization.
M3 (Insight) vs Thynk Business Intelligence: Which Should Your Hotel Choose?
If your hotel operates multiple branded or independent properties with dedicated accounting teams requiring automated invoice processing, GL coding, and financial forecasting, choose M3 Insight. This is supported by M3’s 306 verified reviews, many praising its integration with M3 Accounting Core and STR, enabling real-time invoice data flow that accelerates month-end close and budgeting accuracy. For example, a large portfolio client like GF Hotels & Resorts relies on M3 for scale and visibility.
If your team focuses on revenue management, sales, or commercial operations and needs intuitive, interactive dashboards to track multi-property sales performance, Thynk Business Intelligence is a fit. Thynk’s architecture on Salesforce CRM Analytics supports commercial decision-making, as noted by a German hotel group using Thynk with Mews PMS across 24 hotels. However, Thynk’s review base is limited to 7 total reviews, only 3 recent, which limits confidence in its current product maturity for broad hotel segments.
M3’s data-driven advantages align with accounting-centric hotels and those requiring robust budgeting and forecasting tools. Thynk is better for commercial teams in hotel groups seeking centralized revenue intelligence but still maturing in verified user feedback.
Is M3 (Insight) or Thynk Business Intelligence Easier to Use?
Ease of use is similar between M3 and Thynk, with M3 rated 4.5/5 for ease of use and 4.3/5 for onboarding across 306 reviews, and Thynk rated 4.6/5 ease of use and 4.5/5 onboarding from 7 reviews. Reviewers of M3 frequently highlight its user-friendly interface for accounting tasks and budgeting, though some find navigation and report customization challenging. Thynk reviewers appreciate the simplicity of pages and ability to access the platform anywhere online but mention a steep learning curve in training and navigating complex financial programming.
M3 users report quick access to reports and secure login as operational benefits, supporting daily accounting workflows. Thynk users praise the interactive training and visual appearance, indicating a positive user experience once onboarded. The volume and recency of M3 reviews provide a more reliable representation of usability across hotel roles, while Thynk’s limited data suggests it performs well but needs broader validation.
Edge: Even.
Which Has Better Features: M3 (Insight) or Thynk Business Intelligence?
M3 Insight offers 36 unique hotel-specific features not found in Thynk, which offers none outside the shared 11 features. M3’s exclusive functionalities include Daily Reporting, PMS Mapping, General Ledger management, Accounts Payable automation, Financial Reporting, Cash Management, Budgeting and Forecasting tools, Document Imaging, User Security, Check Writer, and Report Writer. These features transform accounting and financial management workflows by automating manual coding, accelerating month-end closing, and providing detailed cost control analytics.
M3 also includes advanced capabilities such as Labor Standards tracking, Food & Beverage Reporting and Forecasting, Automated Data Gathering & Integration, Revenue Pacing, and an Open API for extensibility. These features enable finance teams and general managers to analyze profitability, forecast labor costs, and integrate multiple data sources seamlessly.
Thynk’s lack of unique features limits its operational breadth, focusing primarily on commercial analytics dashboards without embedded accounting or budgeting tools. This constrains its utility for back-office teams compared to M3’s broader financial management scope.
Edge: M3 (Insight).
Which Has Better Customer Support: M3 (Insight) or Thynk Business Intelligence?
Customer support ratings are close: M3 scores 4.5/5 and Thynk 4.4/5, with onboarding rated 4.3/5 for M3 and 4.5/5 for Thynk. M3 reviewers commonly praise prompt service and helpfulness, with comments like "I've always received prompt service," signifying responsive support critical for accounting teams managing time-sensitive financial workflows. However, some users cite lapses in timely case follow-up.
Thynk reviewers describe training as interactive and helpful, with a trainer called "amazing," supporting commercial team adoption. One reviewer noted that onboarding was too quick, leading to unlearning bad habits, suggesting a need for more tailored support for complex users.
Both products offer strong support experiences, but M3’s larger user base and more extensive financial workflows require consistent service, which it generally delivers with minor exceptions.
Edge: Even.
Which Has More Integrations: M3 (Insight) or Thynk Business Intelligence?
M3 has 42 verified integrations compared to Thynk’s 13, exceeding Thynk by more than 200%. Both share common integrations with Stayntouch, Oracle Hospitality, and Mews PMS, supporting core property management system connections.
M3 uniquely integrates with HOTELTIME, 123compare.me, Birchstreet, STR, Volo, WebRezPro, innRoad, Otelier, yieldPlanet S.A., and more. These integrations enable automated data flow into accounting and forecasting, supporting complex operational reporting and labor management.
Thynk’s unique integrations include MeetingPackage, Planet, hconnect, Sertifi by Flywire, Spazious, Stripe, Cendyn, and Proposales, which are more focused on commercial sales, payments, and guest engagement.
Hotels requiring broad financial data aggregation and back-office automation benefit from M3’s integration depth. Hotels prioritizing commercial sales and event management integration may find Thynk’s partners relevant but limited in scope.
Edge: M3 (Insight).
Which Do Hoteliers Rate Higher: M3 (Insight) or Thynk Business Intelligence?
M3 holds a 4.4/5 overall rating from 306 reviews, with a recent six-month rating of 4.5/5 across 36 reviews, indicating stable or improving satisfaction. Thynk has a 4.2/5 rating from just 7 reviews, with 3 recent, insufficient for statistical confidence.
Segment ratings favor M3 consistently: Bed & Breakfasts & Inns rate M3 4.6/5 on 137 reviews, Branded Hotels 4.5/5 on 216 reviews, and Luxury Hotels 4.5/5 on 63 reviews. Thynk’s limited segment data shows mixed ratings, with a low 3.5/5 for Limited Service & Budget Hotels (1 review) and 4.4/5 for Luxury Hotels (4 reviews).
The volume and recency of M3 reviews provide a stronger evidence base reflecting current product performance. Thynk’s small sample size and lack of recent ratings make its overall rating less reliable.
Edge: Even.
How Much Do M3 (Insight) and Thynk Business Intelligence Cost?
M3 Insight starts at a base price of $300 per month, while Thynk Business Intelligence’s base price is $600 per month. Neither offers freemium, monthly flat, or per-room pricing models, nor implementation fees or trial periods.
M3’s lower base price aligns with its targeting of accounting teams requiring scalability across portfolios without per-room fees. Thynk’s higher base price may reflect its Salesforce Analytics foundation and commercial orientation but lacks published pricing details to justify the cost differences by feature or support.
Hotels evaluating total cost should consider M3’s greater integration and feature set at half the base cost compared to Thynk.
What Type of Hotel Should Use M3 (Insight)?
- Hotels that operate multiple properties requiring consolidated financial reporting and portfolio visibility, as evidenced by large clients like GF Hotels & Resorts.
- Teams focused on back-office accounting automation, benefiting from features like invoice coding, document imaging, and GL management.
- Properties needing robust budgeting and forecasting tools integrated with daily operations to improve financial planning accuracy.
- Hotels wanting broad integration with hotel PMS, labor management, and data providers such as STR and GSS.
- Operations that require granular food & beverage cost analysis and labor standards tracking.
Not ideal if:
- The hotel’s primary need is sales or commercial revenue analytics rather than accounting and finance.
- The team prefers cloud-native, highly customizable commercial intelligence dashboards.
- Limited technical resources exist to manage complex report customization or integration workflows.
What Type of Hotel Should Use Thynk Business Intelligence?
- Hotels with commercial teams focused on sales, revenue management, and event coordination seeking real-time dashboards for multi-property performance.
- Hotel groups using Salesforce CRM wishing to leverage integrated analytics within their existing ecosystem.
- Properties prioritizing ease of access and simple visual interfaces for commercial decision-making.
- Teams that value interactive onboarding and ongoing training to maximize analytic capabilities.
Not ideal if:
- The hotel requires comprehensive financial accounting automation and detailed budget forecasting.
- The property relies heavily on integrations with multiple back-office systems and STR data aggregation.
- The hotel needs a product with a broad and mature user base for stable support and feature development.
M3 (Insight) vs Thynk Business Intelligence: The Bottom Line for Hotels
M3 Insight and Thynk Business Intelligence address hotel business intelligence from different operational angles. M3 delivers a deeply integrated financial analytics platform that automates accounting workflows, budgeting, and forecasting with real-time data integration from multiple hotel systems. Thynk offers commercial analytics dashboards designed to empower sales and revenue teams with actionable insights across multi-property portfolios.
Choose M3 Insight if your hotel requires automated cost control, GL coding, and comprehensive budgeting tools enhanced by extensive integrations, supported by a large and active user base providing stable ongoing feedback. M3’s daily reporting, labor standards features, and open API enable finance and operations teams to reduce manual work and improve financial accuracy.
Opt for Thynk Business Intelligence if your hotel’s focus is commercial performance management within a Salesforce ecosystem, requiring intuitive dashboards and rapid onboarding for sales teams. Thynk suits hotel groups prioritizing revenue analytics over back-office finance but should be chosen with caution given its limited verified reviews and narrower feature set.
M3 Insight leads in feature coverage, integration depth, and scale, making it the stronger choice for hotels seeking a full-spectrum business intelligence solution centered on financial operations. Thynk serves commercial teams well but remains less proven and less feature-rich in accounting-focused tasks.
Hoeveel kosten M3 (Insight) en Thynk Business Intelligence?
Prijzen voor Business Intelligence zijn zelden eenvoudig. Dit is wat we weten op basis van de openbare prijsgegevens van elke leverancier. Vraag altijd een offerte op maat aan voor uw accommodatie.
|
M3
|
Thynk
|
|
|---|---|---|
| Vanafprijs | Vanaf $300/mnd | Vanaf $600/mnd |
Functievergelijking: M3 (Insight) vs Thynk Business Intelligence
Dit zijn de functies die elke leverancier heeft geconfigureerd, geordend per functiegroep — dezelfde gegevens als in het leveranciersdashboard. Vouw een groep uit om functies naast elkaar te vergelijken.
| Functie |
M3
|
Thynk
|
|---|---|---|
|
▾
Analytics
|
|
|
| Aangepaste rapporten en sjablonen | ||
| Netto-inkomsten-KPI's | ||
| Andere inkomensprognoses, rapportage en analyse | ||
| Rapportage, analyse en prognoses voor eten en drinken | ||
| Accounts bijhouden voor bedrijven en reisbureaus | ||
| Analytics-dashboard | ||
| Productiviteitsregistratie van het verkoopteam | ||
| Inkomstentempo | ||
| Dashboarding & datavisualisatie | ||
| Analyse van distributiekosten | ||
| Geplande rapporten | ||
| Tracking op multi-eigendom- en portefeuilleniveau | ||
| Impact van prijsbeslissingen volgen | ||
| Winstgevendheidsbijdrage per klant | ||
| Gedeelde vraagkalender | ||
| Flexibele portefeuillegroepering | ||
| Kunstmatige intelligentie | ||
|
▾
Forecasting, Budgeting & Planning
|
|
|
| Inkomstentempo | ||
| Prognosevergrendeling en workflows | ||
| Op drivers gebaseerde modellen | ||
| Rapportage, analyse en prognoses voor eten en drinken | ||
| Andere inkomensprognoses, rapportage en analyse | ||
| Zakelijke en marketingplannen | ||
| Versiebeheer | ||
| Webgebaseerd | ||
| Impact van prijsbeslissingen volgen | ||
| Gedeelde vraagkalender | ||
| Flexibele portefeuillegroepering | ||
|
▾
Data Management
|
|
|
| Beheer van meerdere panden | ||
| Gecentraliseerd gebruikers- en rolbeheer | ||
| API openen | ||
| Geautomatiseerde gegevensverzameling en -integratie | ||
| Aanpasbare gegevenshiërarchieën | ||
| In-app gegevensbeheer | ||
| Flexibele portefeuillegroepering | ||
|
▾
Collaboration
|
|
|
| Samenwerking en commentaar | ||
| Deelbare sjablonen en plannen | ||
| Bestandsbijlagen | ||
| Webgebaseerd | ||
| Waarschuwingenfeed |
Resultaten uit de praktijk: M3 vs Thynk per bedrijfsdoel
We hebben 5 geverifieerde casestudies geanalyseerd om te vergelijken wat hotels daadwerkelijk bereiken met elk platform op vier belangrijke bedrijfsdoelstellingen.
Yedla Management Company
Middelgroot
"Using M3’s full best-of-suite solutions, we streamline all our information, which automatically feeds from our daily reports, making our financial processes much more efficient."
 Thynk
Nog geen gepubliceerde casestudy voor dit doel.
GF Hotels & Resorts
Groot
"Insight's ability to integrate with third-party data, such as Smith Travel and brand Guest Satisfaction Scores (GSS), is important because owners want to see more than just the rev..."
 Thynk
Nog geen gepubliceerde casestudy voor dit doel.
M3 vs Thynk: De conclusie
Wat hoteliers waarderen
Inzichtdashboards worden beschreven als nuttig om financiële gegevens om te zetten in informatie die het management kan gebruiken om kosten te beheers... Inzichtdashboards worden beschreven als nuttig om financiële gegevens om te zetten in informatie die het management kan gebruiken om kosten te beheersen en de winstgevendheid te verbeteren. Beoordelaars zien waarde in BI-inzicht voor slimmere beslissingen, maar ze willen meer intuïtieve dashboards en eenvoudigere manieren om dieper in de gegevens te duiken.
Beoordelaars benadrukken dat M3 het handmatige werk van coderen, mailen en het opvragen van factuurgegevens vermindert, wat aanzienlijke tijd bespaart... Beoordelaars benadrukken dat M3 het handmatige werk van coderen, mailen en het opvragen van factuurgegevens vermindert, wat aanzienlijke tijd bespaart voor general managers en boekhoudpersoneel. Het hulpmiddel lijkt de backofficeprocessen te stroomlijnen en de arbeidskosten te verlagen door repetitieve financiële taken te automatiseren.
Sommige gebruikers vinden het platform gemakkelijk in gebruik en navigatie, vooral voor dagelijkse taken, terwijl anderen specifiek de Insight-ervarin... Sommige gebruikers vinden het platform gemakkelijk in gebruik en navigatie, vooral voor dagelijkse taken, terwijl anderen specifiek de Insight-ervaring bekritiseren als niet intuïtief genoeg. De feedback suggereert dat gebruiksvriendelijkheid over het algemeen een sterke kant is, maar dat complexere analysetaken nog vereenvoudigd moeten worden.
Waar hoteliers kritiek op hebben
Verschillende beoordelaars noemen grootboekcodering en rapportage als een belangrijke use case, waarbij M3 gecodeerde gegevens en rapporten rechtstree... Verschillende beoordelaars noemen grootboekcodering en rapportage als een belangrijke use case, waarbij M3 gecodeerde gegevens en rapporten rechtstreeks naar het dashboard stuurt voor boekhoudkundige controle. Gebruikers waarderen het om de financiële structuur en rapportoutputs die ze nodig hebben op één plek te hebben, hoewel de flexibiliteit bij het maken van rapporten soms een probleem is.
Een recensent bekritiseert de opvolging door support sterk en zegt dat ze geen tijdige terugbelacties of updates meer ontvangen bij het openen van een... Een recensent bekritiseert de opvolging door support sterk en zegt dat ze geen tijdige terugbelacties of updates meer ontvangen bij het openen van een case. Dit geeft aan dat de reactietijd van de service de algehele ervaring negatief kan beïnvloeden, zelfs als de software zelf nuttig is.
Scoort hoger op
Unieke mogelijkheden
Scoort hoger op
Veelgestelde vragen over M3 (Insight) vs Thynk Business Intelligence
Kan M3 (Insight) Thynk Business Intelligence vervangen?
Dat hangt af van uw eisen. M3 (Insight) en Thynk Business Intelligence delen veel kern-Business Intelligence-functies, maar elk heeft unieke mogelijkheden. M3 (Insight) biedt 42 geverifieerde integratiepartners, terwijl Thynk Business Intelligence er 13 biedt. Bekijk de functievergelijking hierboven om te zien waar ze verschillen voordat u overstapt.
Welke is beter voor kleine of onafhankelijke hotels?
Kleine hotels moeten prioriteit geven aan gebruiksgemak en snelle onboarding. M3 (Insight) scoort het hoogst op gebruiksgemak met 4,5/5 vs 4,5/5. Let op transparante prijzen en de mogelijkheid van een proefperiode of demo. Filter beoordelingen op elke productpagina op accommodatiegrootte om te horen van hotels zoals het uwe.
Bieden M3 (Insight) of Thynk Business Intelligence een gratis abonnement aan?
M3 (Insight): Nee. Thynk Business Intelligence: Nee. Geen van beide producten biedt momenteel een gratis abonnement aan. De meeste Business Intelligence-leveranciers bieden demo's of proefperiodes aan — vraag er bij beide een aan om te evalueren voordat u zich vastlegt.
Hoe evalueert en rangschikt HTR M3 (Insight) en Thynk Business Intelligence?
De HT Score is een samengestelde ranglijst die 4 criteriagroepen en meer dan een dozijn variabelen meeweegt om hoteliers te helpen hoteltechnologieproducten objectief te vergelijken. M3 heeft een HT Score van 95 en Thynk heeft 0. Zo wordt de score berekend.
| Criteriagroep | Weging | Wat het meet |
|---|---|---|
| Klantbeoordelingen & reviews |
|
Hoe hoog beoordelen gebruikers dit product? Beoordelingsscore, reviewvolume, share of voice, reviewdiepte, reviewrecentheid, succesverhalen ▾ De zwaarst gewogen factor. Analyseert gemiddelde tevredenheidsbeoordelingen (waarschijnlijkheid om aan te bevelen, gebruiksgemak, ondersteuning, ROI), het totale aantal reviews ten opzichte van categoriegenoten, recentheid van reviews (minimaal 20 reviews in de afgelopen 6 maanden) en share of voice over unieke hotelklanten om selectiebias te detecteren. |
| Partnerecosysteem |
|
Hoe hoog beoordelen technologiepartners dit bedrijf? Partneraanbevelingen, integratieaantal, integratiekwaliteit ▾ Evalueert partneraanbevelingen als expertstemmen van vertrouwen, het aantal geverifieerde integraties en ecosysteemkwaliteit — de gemiddelde HT Scores van integratiepartners. Producten met een kwalitatief beter integratie-ecosysteem leveren waarschijnlijker een verbonden tech stack. |
| Klantgerichtheid |
|
Hoe klantgericht is deze organisatie? Gecertificeerde ondersteuning, reviewconsistentie, profielvolledigheid ▾ Beoordeelt of het bedrijf HTR Customer Support-certificering heeft verdiend, consistente reviewverzameling in de loop der tijd onderhoudt (een indicator van feedbackgedreven cultuur) en productprofielen compleet houdt met mogelijkheden, schermafbeeldingen, prijzen en functies. |
| Bereik, stabiliteit & middelen |
|
Hoe uitgebreid is het bereik en de middelen van dit bedrijf? Geografisch bereik, stabiliteit, bedrijfsmiddelen, trendscore ▾ Meet wereldwijde aanwezigheid (bediende landen en regio's), aantal jaren in bedrijf als stabiliteitsindicator, teamgrootte als middelenproxy en een trendscore op basis van kopersaanvragen, reviews, partneraanbevelingen en persactiviteit in de afgelopen twaalf maanden. |
Klantbeoordelingen en reviews zijn veruit de belangrijkste factor in het HT Score-algoritme. HTR accepteert geen betaling voor hogere ranglijstposities. Alle reviews zijn geverifieerd — alleen professionals uit de hotelbranche met bevestigde affiliaties kunnen beoordelingen indienen. Bekijk de volledige HT Score-methodologie →
Welke andere Business Intelligence-vergelijkingen lezen hoteliers?
Ontdek meer directe vergelijkingen op basis van geverifieerde hotelierbeoordelingen.



Inhoud
Ontvang uw gratis AI-analyserapport
Aanbevelingen op maat, afgestemd op uw accommodatie.


