

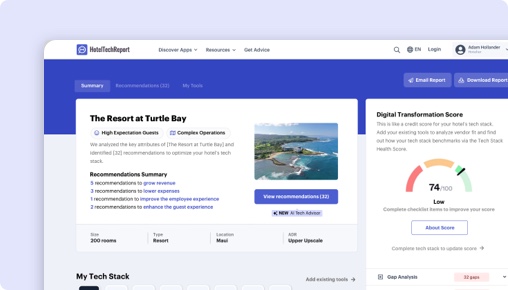
申し訳ございません。この機能は認証済みのホテル運営者のみご利用いただけます
プロジェクトダッシュボードは、認証済みのホテル運営者のみが利用できる無料ツールです。調査を効率化し、コミュニケーションの流れを簡素化することで、新しいテクノロジーの導入を容易にします。

Benchmarking Alliance vs. M3 (Insight):
あなたに最適なのはどちら?
要点
274件の認証済みホテル経営者レビューを分析し、機能セット、料金、実際の導入事例を比較して、各プラットフォームの強みを明らかにしました。最適な選択は、施設の種類と優先事項によって異なります:
Benchmarking Alliance 優れています 、Shared Demand Calendarなどの独自機能を備えています.
M3 優れています ease of use and customer supportにおいて — 特にbrandの施設向け (4.1/5) 、Daily Reporting and Financial Reportingなどの独自機能を備えています.
Benchmarking AllianceとM3 (Insight)の比較
HTRの274件の認証済みホテル経営者レビューに基づく並列評価。
| HTScore |
|
|
| 推奨度 |
|
|
| 使いやすさ |
|
|
| カスタマーサポート |
|
|
| コストパフォーマンス |
|
|
| 開始価格 | $100/月〜 | $300/月〜 |
| 認証済みレビュー | 0 | 274 |
Benchmarking AllianceとM3 (Insight)の長所と短所は?
274件の認証済みレビューを分析した結果、Benchmarking Allianceのユーザーはを最も評価し、M3のユーザーは安全でシンプルなログインプロセス, 効率的なレポート検索を高く評価しています。各テーマをクリックすると、レビュー投稿者の声をご覧いただけます。
 Benchmarking Alliance
|
 M3
M3
|
|---|---|
| 長所 | |
|
+
安全でシンプルなログインプロセス
▾
|
|
|
+
効率的なレポート検索
▾
|
|
| 短所 | |
Benchmarking Alliance vs M3:ホテルセグメント別ランキング
各セグメントのホテル経営者による認証済みレビューに基づく、施設規模・タイプ・地域別のビジネスインテリジェンスベンダー内ランキング。
ホテル規模別
| セグメント |
Benchmarking Alliance
|
M3
|
|---|---|---|
| 小規模(10〜24室) ▾ | — | #6 13件のレビュー |
| 中規模(25〜74室) ▾ | — | #3 171件のレビュー |
| 大規模(75〜199室) ▾ | — | #4 39件のレビュー |
| 特大規模(200室以上) ▾ | — | #5 19件のレビュー |
施設タイプ別
| セグメント |
Benchmarking Alliance
|
M3
|
|---|---|---|
| ブティック ▾ | — | #3 107件のレビュー |
| ラグジュアリー ▾ | — | #5 53件のレビュー |
| ブランド/チェーン ▾ | — | #3 180件のレビュー |
| 長期滞在型 ▾ | — | #3 30件のレビュー |
地域別
| セグメント |
Benchmarking Alliance
|
M3
|
|---|---|---|
| 北米 ▾ | — | #2 241件のレビュー |
| ヨーロッパ | — | #25 2件のレビュー |
| アジア太平洋 ▾ | — | #17 5件のレビュー |
| 中東 | — | #15 0件のレビュー |
The Decision
Choosing the right business intelligence platform for your hotel hinges on understanding each product’s core strengths and how they align with your operational needs. Benchmarking Alliance by Benchmarking Alliance focuses on providing detailed competitor benchmarks to boost revenue, primarily in the Nordic and Baltic regions. Conversely, M3 (Insight) from M3 offers a broad suite of analytics, financial management, and operational tools with extensive integration options, mainly serving the North American market.
Both products aim to help you make data-driven decisions, but they do so through different lenses. Benchmarking Alliance emphasizes comparative performance metrics, while M3 provides a comprehensive analytics ecosystem. Are you prioritizing regional benchmarking accuracy or integrated operational insights?
Is Benchmarking Alliance or M3 Better for Hotels?
Benchmarking Alliance specializes in delivering precise, competitive benchmarks based on data from over 2,500 hotels, predominantly in Europe. Your team will find it invaluable if your focus is on understanding how your property stacks against regional competitors to identify revenue opportunities. However, its limited feature set—only 16 shared features—means it lacks operational tools like budgeting or forecasting, which are more robust in M3.
M3, with a review count of 237 and recent reviews in the last six months, boasts a 4.16/5 overall rating and a 92.5/100 HTR score, indicating a more reliable and current user experience. Its extensive feature set and higher customer satisfaction make it the stronger choice if you need a full operational BI platform. Do you need in-depth benchmarking or a broader operational toolkit?
M3 vs Benchmarking Alliance: Which Should Your Hotel Choose?
If your hotel needs precise regional performance benchmarks to inform revenue management strategies, Benchmarking Alliance is a compelling choice due to its specialized focus and regional coverage. Its core offering of competitor KPIs helps you identify market gaps and optimize pricing strategies effectively.
On the other hand, if you require a robust, all-in-one BI solution that covers financial reporting, forecasting, labor management, and integration with industry data sources, M3 is the better fit. Its 31 unique features, including daily reporting, general ledger, and forecasting, serve hotels looking for comprehensive operational insights.
Hotels in Europe aiming for regional benchmarking should lean toward Benchmarking Alliance. Hotels seeking a broader, integrated solution suited for North American markets and larger portfolios should prioritize M3.
Is Benchmarking Alliance or M3 Easier to Use?
Benchmarking Alliance does not provide extensive user experience data but, given its narrow focus, is likely straightforward for users primarily interested in benchmarking metrics. M3, rated 4.46/5 for ease of use based on 237 reviews, impresses with its intuitive dashboard, secure login, and quick report retrieval. Users praise its straightforward navigation and efficient onboarding, with a review stating, "Support at M3 is always quick and personal with follow-up throughout the process."
Edge: M3.
Which Has Better Features: Benchmarking Alliance or M3?
Benchmarking Alliance offers only 16 shared features, including competitor KPIs and demand calendars, making it suitable for benchmarking but limited in operational functions. M3, with 31 features, surpasses this by including daily reporting, general ledger, budgeting, forecasting, labor standards, report writer, and API access.
The additional capabilities in M3 enable comprehensive management of hotel finances, labor, and performance data, whereas Benchmarking Alliance stays focused on performance comparison. If your hotel needs a full operational BI suite, M3’s feature set clearly delivers more value.
Edge: M3.
Which Has Better Customer Support: Benchmarking Alliance or M3?
While Benchmarking Alliance’s support ratings are unavailable, M3's user feedback highlights its support team as prompt and personable, with an average rating of 4.48/5. Reviewers appreciate quick responses and ongoing follow-up, describing support as "support at M3 is always quick and personal." This consistency enhances onboarding and daily use.
Given the lack of support data for Benchmarking Alliance, the clear choice is M3, backed by positive recent reviews. Support quality significantly impacts operational continuity and ease of use.
Edge: M3.
Which Has More Integrations: Benchmarking Alliance or M3?
Benchmarking Alliance integrates with 19 verified partners, including Juyo Analytics and VISIT, focusing on niche industry integrations. M3 offers 39 verified partners, including major property management systems like Mews, STR, InnRoad, and Birchstreet, providing a broader set of integration options for operational data.
The extensive integration network in M3 allows your hotel to connect with essential industry tools, feeding comprehensive data into its analytics environment. If seamless system interoperability is critical, M3’s integrations outperform those of Benchmarking Alliance.
Edge: M3.
Which Do Hoteliers Rate Higher: Benchmarking Alliance or M3?
Since Benchmarking Alliance has no reviews listed, we rely on M3’s data—237 reviews with a 4.16/5 overall rating. Hotels across various segments praise M3 for its ease of use, support, and feature richness, especially in North American markets.
In recent reviews, properties value M3’s ability to consolidate data and provide actionable insights, with quotes like, "Insight's ability to integrate with third-party data is important because owners want to see more than just revenue from the day." M3’s high review count and recent feedback make it the more trusted choice among hoteliers.
Edge: M3.
How Much Do Benchmarking Alliance and M3 Cost?
Benchmarking Alliance’s pricing begins at $100 per month, with no free trial or tiered options mentioned. M3’s base price is $300 per month, also without a trial, reflecting its broader feature set and integrations.
While Benchmarking Alliance offers a lower entry point, its limited features might justify the higher investment in M3 if your hotel needs operational insights as well as benchmarking. Cost should be weighed against the value of the deeper capabilities.
What Type of Hotel Should Use Benchmarking Alliance?
Hotels that primarily focus on regional revenue benchmarking to refine pricing and market positioning will benefit from Benchmarking Alliance’s detailed competitor data. Teams that want clear, region-specific insights into market performance without needing extensive operational tools are ideal users.
Not ideal if your hotel requires comprehensive financial management, forecasting, or labor tools, as Benchmarking Alliance’s limited feature set doesn’t support these needs. It’s better suited for hotels aiming to refine revenue strategies through competitive benchmarking alone.
- Hotels that want to compare KPIs against regional competitors
- Teams focused on revenue maximization through benchmarking
- Hotels with a regional, Nordic, or Baltic presence
Not ideal if your hotel needs integrated financial, forecasting, or operational tools. Larger portfolios or North American-focused properties should consider M3 instead.
What Type of Hotel Should Use M3?
Hotels seeking a full-featured business intelligence platform to manage finances, labor, and operational data should choose M3. It is also well-suited for hotels with complex reporting needs, such as daily operational dashboards, forecasting, and integration with third-party data sources.
Not ideal if your hotel only requires benchmarking data or operates in a limited regional market, especially outside North America, since M3’s strength lies in its extensive feature set and broad integrations.
- Hotels that need operational analytics and financial management
- Teams that want customizable reports, forecasting, and integration
- Larger hotels or portfolios with complex data needs
Not ideal if your hotel prioritizes regional benchmarking only or has minimal data management requirements.
The Bottom Line for Hotels
Benchmarking Alliance provides specialized competitor benchmarks with regional insights, mainly suited for hotels in Europe aiming to refine revenue strategies. Its limited features make it less suitable for full operational management.
M3 offers a comprehensive suite of tools covering financials, forecasting, labor, and integrations, making it the clear choice for hotels in North America or those requiring extensive operational insights. Its higher review count and recent positive feedback give it a distinct advantage.
If your hotel prioritizes regional benchmarking accuracy, especially in Europe, Benchmarking Alliance may suffice. For broader operational needs, especially in North America, M3 offers a more complete platform.
For most hoteliers seeking a proven, feature-rich BI solution, M3’s extensive capabilities and recent high ratings make it the recommended choice. Benchmarking Alliance is ideal if your focus is solely on competitor benchmarking within its regional scope.
Benchmarking AllianceとM3 (Insight)の費用は?
ビジネスインテリジェンス の料金はわかりにくいことが多いです。各ベンダーの公開料金データから判明している情報をまとめました。施設の規模に合わせたカスタム見積もりを必ずご依頼ください。
|
Benchmarking Alliance
|
M3
|
|
|---|---|---|
| 開始価格 | $100/月〜 | $300/月〜 |
機能比較:Benchmarking Alliance と M3 (Insight)
これらは各ベンダーが設定した機能で、機能グループごとに整理されており、ベンダーダッシュボードに表示されるデータと同じです。グループを展開すると、機能を並べて比較できます。
| 機能 |
Benchmarking Alliance
|
M3
|
|---|---|---|
|
▾
Analytics
|
|
|
| カスタムレポートとテンプレート | ||
| 純収益KPI | ||
| その他の収入の予測、報告、分析 | ||
| 食品および飲料のレポート、分析、および予測 | ||
| 企業および旅行代理店のアカウント追跡 | ||
| 分析ダッシュボード | ||
| 営業チームの生産性追跡 | ||
| 収益のペース | ||
| ダッシュボードとデータの視覚化 | ||
| 流通コスト分析 | ||
| スケジュールレポート | ||
| 複数物件およびポートフォリオレベルの追跡 | ||
| 価格決定の影響追跡 | ||
| 顧客別の収益貢献 | ||
| 共有需要カレンダー | ||
| 柔軟なポートフォリオのグループ化 | ||
| 人工知能 | ||
|
▾
Forecasting, Budgeting & Planning
|
|
|
| 収益のペース | ||
| 予測ロックとワークフロー | ||
| ドライバーベースのモデル | ||
| 食品および飲料のレポート、分析、および予測 | ||
| その他の収入の予測、報告、分析 | ||
| ビジネス&マーケティング計画 | ||
| バージョン管理 | ||
| ウェブベース | ||
| 価格決定の影響追跡 | ||
| 共有需要カレンダー | ||
| 柔軟なポートフォリオのグループ化 | ||
|
▾
Data Management
|
|
|
| マルチプロパティマネジメント | ||
| 一元化されたユーザーと役割の管理 | ||
| オープンAPI | ||
| 自動化されたデータ収集と統合 | ||
| カスタマイズ可能なデータ階層 | ||
| アプリ内データ管理 | ||
| 柔軟なポートフォリオのグループ化 | ||
|
▾
Collaboration
|
|
|
| コラボレーションとコメント | ||
| 共有可能なテンプレートとプラン | ||
| ファイル添付 | ||
| ウェブベース | ||
| アラートフィード |
実際の成果:ビジネス目標別のBenchmarking Alliance vs M3
3件の認証済みケーススタディを分析し、4つの主要ビジネス目標において各プラットフォームでホテルが実際に達成した成果を比較しました。
Benchmarking Alliance
この目標に関するケーススタディはまだ公開されていません。
Yedla Management Company
中規模
"Using M3’s full best-of-suite solutions, we streamline all our information, which automatically feeds from our daily reports, making our financial processes much more efficient."
 Benchmarking Alliance
この目標に関するケーススタディはまだ公開されていません。
GF Hotels & Resorts
大規模
"Insight's ability to integrate with third-party data, such as Smith Travel and brand Guest Satisfaction Scores (GSS), is important because owners want to see more than just the rev..."

Benchmarking Alliance vs M3:まとめ
ホテル経営者が高く評価する点
ユーザーは、安全で簡単なログインプロセスを特に重視しており、安全性の確保とユーザビリティの向上に役立っています。これにより、プラットフォーム全体のナビ... ユーザーは、安全で簡単なログインプロセスを特に重視しており、安全性の確保とユーザビリティの向上に役立っています。これにより、プラットフォーム全体のナビゲーションがスムーズになり、日々の業務効率の向上に大きく貢献しています。
レポートを素早く取得して検索できる機能は、レポート検索の効率性全体を向上させるため、高く評価されています。ユーザーは、この機能がデータアクセスの効率化... レポートを素早く取得して検索できる機能は、レポート検索の効率性全体を向上させるため、高く評価されています。ユーザーは、この機能がデータアクセスの効率化に役立ち、情報に基づいた意思決定と業務の最適化に不可欠であると感じています。
独自の機能
評価が最も分かれる分野
Benchmarking Alliance vs M3 (Insight)に関するよくある質問
Benchmarking AllianceはM3 (Insight)の代わりになりますか?
お客様の要件次第です。Benchmarking AllianceとM3 (Insight)は多くの主要なBusiness Intelligence機能を共有していますが、それぞれに独自の機能があります。Benchmarking Allianceは18件の認証済み連携パートナーを持ち、M3 (Insight)は39件を持っています。切り替え前に、上記の機能比較で違いをご確認ください。
小規模または独立系ホテルにはどちらが適していますか?
小規模ホテルは使いやすさと迅速なオンボーディングを優先すべきです。M3 (Insight)は使いやすさで4.5/5対0.0/5とリードしています。透明性のある料金設定とトライアルまたはデモのオプションを探しましょう。各製品ページで施設規模別にレビューをフィルタリングして、同様のホテルからの声を確認してください。
Benchmarking AllianceまたはM3 (Insight)に無料プランはありますか?
Benchmarking Alliance:いいえ。M3 (Insight):いいえ。 どちらの製品も現在無料プランを提供していません。ほとんどのBusiness Intelligenceベンダーはデモまたはトライアルを提供しています — 契約する前に各社にご依頼ください。
HTRはBenchmarking AllianceとM3 (Insight)をどのように評価・ランク付けしていますか?
HT Scoreは、ホテル経営者がホテルテクノロジー製品を客観的に比較できるよう、4個の基準グループと十数の変数を考慮した総合ランキングです。Benchmarking AllianceのHT Scoreは0、M3は95です。以下がスコアの算出方法です。
| 基準グループ | ウェイト | 測定内容 |
|---|---|---|
| 顧客評価とレビュー |
|
ユーザーはこの製品をどの程度推奨していますか? 評価スコア、レビュー数、シェアオブボイス、レビューの深さ、レビューの新しさ、成功事例 ▾ 最も重みの大きい要素です。平均満足度評価(推奨度、使いやすさ、サポート、ROI)、カテゴリー内の競合に対するレビュー総数、レビューの新しさ(直近6か月間に20件以上のレビュー)、固有のホテルクライアント全体のシェアオブボイスを分析して選択バイアスを検出します。 |
| パートナーエコシステム |
|
テクノロジーパートナーはこの企業をどの程度推奨していますか? パートナー推奨、連携数、連携品質 ▾ パートナー推奨を専門家の信頼票として評価し、認証済み連携の数、エコシステムの品質 — 連携パートナーの平均HT Scoreを評価します。より高品質な連携エコシステムを持つ製品は、接続されたテックスタックを提供する可能性が高くなります。 |
| 顧客中心主義 |
|
この組織はどの程度顧客中心ですか? 認定サポート、レビューの一貫性、プロフィールの完全性 ▾ 企業がHTRカスタマーサポート認定を取得しているか、長期にわたり一貫したレビュー収集を維持しているか(フィードバック主導の文化の指標)、機能、スクリーンショット、料金、特徴を含む完全な製品プロフィールを維持しているかを評価します。 |
| リーチ、継続性、リソース |
|
この企業のリーチとリソースはどの程度広範ですか? 地理的リーチ、継続性、企業リソース、トレンドスコア ▾ グローバルプレゼンス(対応国・地域)、安定性の指標としての事業年数、リソースの指標としてのチーム人数、直近12か月の購入者からの問い合わせ・レビュー・パートナー推奨・プレス活動に基づくトレンドスコアを測定します。 |
顧客評価とレビューは、HT Scoreアルゴリズムにおいて最も重要な要素です。HTRはランキング向上のための支払いを受け付けていません。すべてのレビューは認証済みです — 所属が確認されたホテル業界の実務者のみが評価を投稿できます。 HT Scoreの詳細な算出方法を見る →
ホテル経営者が読んでいるその他のビジネスインテリジェンス比較
認証済みホテル経営者レビューに基づく、その他の一対一比較をご覧ください。





無料のAIアナリストレポートを入手しよう
お客様の施設に合わせたカスタム提案


