

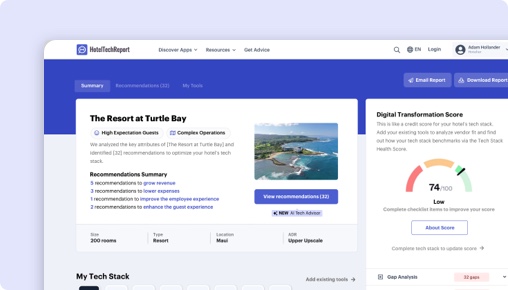
Spiacenti, questa funzionalità è disponibile solo per gli albergatori verificati
La dashboard dei progetti è uno strumento gratuito disponibile solo per gli albergatori verificati, che semplifica l'adozione di nuove tecnologie snellendo la ricerca e i flussi di comunicazione.

Climber, a Revenue Analytics Company vs. hotellab:
Qual è Quello Giusto per Te?

TLDR
Abbiamo analizzato 103 recensioni verificate di albergatori, confrontato funzionalità, prezzi e casi studio reali per evidenziare dove ciascuna piattaforma eccelle. La scelta giusta dipende dal tipo di hotel e dalle tue priorità:
Climber a Revenue Analytics Company eccelle , con funzionalità esclusive come Analytics dashboard and Price sensitivity modeling.
hotellab eccelle per quanto riguarda impatto su tariffa media giornaliera (adr), tasso di occupazione e fatturato , con funzionalità esclusive come Mobile Friendly Design and Controlled Automation/Algorithm Customization.
Come si Confronta Climber, a Revenue Analytics Company con hotellab?
Valutazioni fianco a fianco basate su 103 recensioni verificate di albergatori su HTR.
| HTScore |
|
|
| Probabilità di Raccomandazione |
|
|
| Facilità d'Uso |
|
|
| Assistenza Clienti |
|
|
| Rapporto Qualità-Prezzo |
|
|
| Prezzo di Partenza | Da $1,000/mese | Da $500/mese |
| Recensioni Verificate | 9 | 94 |
Quali Sono i Pro e i Contro di Climber, a Revenue Analytics Company vs hotellab?
Dopo aver analizzato 103 recensioni verificate, gli utenti di Climber a Revenue Analytics Company apprezzano maggiormente , mentre gli utenti di hotellab evidenziano impatto su tariffa media giornaliera (adr), tasso di occupazione e fatturato, esigenze di personalizzazione per immobili di piccole dimensioni, automazione e pilota automatico. Clicca su qualsiasi tema per vedere cosa dicono i recensori.
|
Climber a Revenue Analytics Company
|
hotellab
|
|---|---|
| Pro | |
|
+
Impatto su tariffa media giornaliera (ADR), tasso di occupazione e fatturato
▾
|
|
|
+
Esigenze di personalizzazione per immobili di piccole dimensioni
▾
|
|
|
+
Automazione e pilota automatico
▾
|
|
|
+
Business Intelligence
▾
|
|
| Contro | |
Climber a Revenue Analytics Company vs hotellab: Classifiche per Segmento Alberghiero
Come si classifica ciascun prodotto tra i fornitori di Sistemi di gestione delle entrate per diverse dimensioni di struttura, tipologie di hotel e regioni — basato su recensioni verificate di albergatori in ogni segmento.
Per Dimensione Hotel
| Segmento |
Climber a Revenue Analytics Company
|
hotellab
|
|---|---|---|
| Piccolo (10-24 camere) ▾ | #37 2 recensioni | #19 20 recensioni |
| Medio (25-74 camere) ▾ | #36 5 recensioni | #16 18 recensioni |
| Grande (75-199 camere) ▾ | #24 2 recensioni | #9 9 recensioni |
Per Tipo di Hotel
| Segmento |
Climber a Revenue Analytics Company
|
hotellab
|
|---|---|---|
| Boutique ▾ | #35 6 recensioni | #14 30 recensioni |
| Lusso ▾ | #36 3 recensioni | #16 21 recensioni |
| Brand / Catena ▾ | #38 2 recensioni | #21 7 recensioni |
| Soggiorno Prolungato ▾ | — | #11 11 recensioni |
Per Regione
| Segmento |
Climber a Revenue Analytics Company
|
hotellab
|
|---|---|---|
| Nord America | #37 0 recensioni | #31 1 recensioni |
| Europa ▾ | #24 8 recensioni | #14 44 recensioni |
| Asia Pacifico | — | #24 0 recensioni |
| Medio Oriente ▾ | — | #6 6 recensioni |
The Decision
Choosing between Climber, a Revenue Analytics Company, and hotellab hinges on your hotel’s specific revenue management needs. Both products aim to optimize pricing and boost revenue, but they approach this goal differently. Climber provides a straightforward, AI-powered pricing tool with a limited feature set but very high user satisfaction. Hotellab, on the other hand, offers a broader set of functionalities with extensive customization options. Which system aligns best with your hotel’s operational complexity and growth ambitions?
Climber’s focus on automation and simplicity makes it ideal for hotels seeking an easy-to-implement solution that delivers quick results. Hotellab appeals to hotels wanting a more comprehensive and adaptable platform with advanced features for long-term strategic control. But how do they compare across key areas? Let’s explore.
Is Climber or hotellab Better for Hotels?
Climber and hotellab are both designed to improve hotel revenue but differ significantly in their scope and target users. Climber automates pricing up to 24 times daily, focusing on dynamic rate adjustments based on demand, competition, and proprietary data. It’s built for hotels that prefer a hands-off approach, relying on AI to optimize rates without extensive manual input.
Hotellab offers a wider range of features—28 exclusive to it—such as group pricing, open pricing, AI optimization, and multi-factor authentication. It’s better suited for hotels that seek detailed control over their pricing strategies with customization options and advanced forecasting tools.
Climber’s reviews are limited but highly positive, emphasizing ease of use, speed, and a strong relationship with support. Hotellab’s recent reviews are more numerous and recent, highlighting its sophisticated features and flexibility. Which one better fits your hotel’s approach?
Climber or hotellab: Which Should Your Hotel Choose?
If your hotel needs a straightforward, AI-driven system that continuously updates rates to maximize revenue with minimal manual effort, Climber is the clear choice. It’s especially suitable for hotels that prioritize automation and operate in competitive markets where quick, data-driven adjustments matter.
If your hotel requires a highly customizable platform with a comprehensive suite of tools—like group pricing, open pricing, demand forecasting, and API integrations—hotellab is the better fit. Its features are designed for hotels that want granular control and long-term strategic planning, especially if they operate in complex markets or belong to large groups.
In summary, choose Climber for simplicity and speed; opt for hotellab if you need detailed control and extensive functionalities. But which one actually performs better in practice?
Is Climber or hotellab Easier to Use?
Climber’s interface is praised for being intuitive, with a user-friendly dashboard that simplifies complex data. Its onboarding process is rated 4.78/5, with users describing it as quick and easy to set up, and the team as very supportive. Reviewers highlight how effortless it is to get started and see results, with many noting no major issues during integration.
Hotellab scores even higher in ease of use at 4.92/5, with users citing its clean design and customizable dashboard as major strengths. Its onboarding process is similarly rated highly, and users appreciate the platform’s flexibility in configuring key parameters. The only caveat is that its extensive features may require a learning curve for some staff.
Edge: hotellab.
Which Has Better Features: Climber or hotellab?
Climber offers two exclusive features: an analytics dashboard and price sensitivity modeling. Its core strength lies in automating rate adjustments based on demand, competition, and proprietary data, helping hotels improve revenue without heavy manual input.
Hotellab boasts 28 exclusive features, including group pricing & evaluation, open pricing, AI optimization, business intelligence, forecast explanation, and multi-factor authentication. It provides tools like demand forecasting over 18 months, inventory management, and advanced scenario planning, making it suitable for hotels that want granular control.
With more features tailored to detailed revenue strategies, hotellab edges out Climber here, especially for hotels seeking control and customization.
Edge: hotellab.
Which Has Better Customer Support: Climber or hotellab?
Climber’s support is rated 5/5, with reviews emphasizing the friendly, efficient team that is always available to assist. Users describe their support experience as excellent, highlighting prompt responses and effective problem-solving.
Hotellab’s support also receives near-perfect ratings at 4.97/5. Reviewers appreciate the knowledgeable, responsive team that provides comprehensive training and customization assistance. Some users wish for faster response times, but overall, support quality remains high.
Edge: Climber, due to slightly more recent positive feedback and consistent top ratings.
Which Has More Integrations: Climber or hotellab?
Climber has 7 verified partners, including Lighthouse, Omnibees, SiteMinder, and others, focusing on key industry integrations. Hotellab supports 14 verified partners, including major players like Oracle Hospitality, Mews, and TravelLine, offering broader connectivity.
Both systems integrate with essential PMS and channel managers, but hotellab’s larger partner network provides more options for hotels with diverse tech stacks. If your existing setup relies on specific integrations, check compatibility.
Edge: hotellab.
Which Do Hoteliers Rate Higher: Climber or hotellab?
Climber’s reviews are limited to 9, all rating 5/5, but the sample size is small and from hotels across Europe and South America. Hotellab’s 64 reviews are more recent and contain an even higher average rating of 80.6/100, with many praising its flexibility and revenue results.
Hotellab’s reviews cover a broader segment of hotels, including luxury and boutique properties, with many reviews from the last 6 months. Its large review base and recent feedback make it the more trusted choice among hoteliers.
Edge: hotellab.
How Much Do Climber and hotellab Cost?
Climber charges a flat monthly fee of $1,000, with no free tier or trial offers. It’s a higher upfront cost but may be justified by its automation and AI-driven results.
Hotellab’s pricing is $500 per month, also without a trial, making it more accessible for smaller hotels or those with tighter budgets. Its lower cost combined with extensive features offers good value but may require more skilled staff to maximize.
What Type of Hotel Should Use Climber?
- Hotels that want a simple, automated revenue management system that requires minimal manual input.
- Properties in highly competitive markets where rapid rate adjustments are critical.
- Hotels seeking consistent, AI-driven pricing updates up to 24 times per day.
- Teams that prefer a straightforward solution with a quick setup.
- Hotels that prioritize ease of onboarding and support.
Not ideal if:
- You require detailed control over pricing strategies.
- Your hotel operates in markets with complex revenue management needs.
- You want advanced forecasting, scenario planning, or customization.
What Type of Hotel Should Use hotellab?
- Hotels that need a highly customizable platform with a broad range of features.
- Properties that operate in complex markets or belong to large groups.
- Hotels seeking detailed forecasting, inventory management, and scenario planning.
- Teams that want to configure dashboards with up to 60 parameters.
- Hotels looking for an integrated, flexible system capable of managing multiple revenue streams.
Not ideal if:
- You prefer a simple, automated pricing tool without the need for extensive customization.
- Your hotel has fewer than 15 rooms or operates as a small bed & breakfast.
- You need a quick, straightforward implementation without extensive setup.
The Bottom Line for Hotels
Climber offers a streamlined, AI-powered pricing system that excels in ease of use and rapid deployment. Its core advantage is automating rate adjustments up to 24 times daily, making it ideal for hotels that prefer a hands-off approach to revenue management.
Hotellab provides a more extensive set of features, with a high degree of customization, forecasting, and scenario planning capabilities. Its recent reviews and broader feature set make it suitable for hotels that want control and strategic flexibility.
If your priority is quick, automated revenue boosts with minimal fuss, Climber is the better choice. If you seek a full-featured, adaptable platform to refine your revenue strategies long-term, hotellab is the more appropriate option.
In conclusion, choose Climber for simplicity and automation, especially if your hotel’s operational focus is on speed and ease. Select hotellab if your hotel requires detailed control, forecasting, and customization to support complex revenue strategies. Both are excellent, but your specific needs should guide the decision.
Quanto Costano Climber, a Revenue Analytics Company e hotellab?
I prezzi di Sistemi di gestione delle entrate raramente sono semplici. Ecco cosa sappiamo dai dati pubblici sui prezzi di ciascun fornitore. Richiedi sempre un preventivo personalizzato per la dimensione della tua struttura.
|
Climber a Revenue Analytics Company
|
hotellab
|
|
|---|---|---|
| Prezzo di Partenza | Da $1,000/mese | Da $500/mese |
Confronto delle funzionalità: Climber, a Revenue Analytics Company vs hotellab
Queste sono le funzionalità configurate da ciascun fornitore, organizzate per gruppo di funzionalità — gli stessi dati mostrati nella dashboard del fornitore. Espandi un gruppo per confrontare le funzionalità affiancate.
| Funzionalità |
Climber a Revenue Analytics Company
|
hotellab
|
|---|---|---|
|
▾
Ottimizzazione dei prezzi
|
|
|
| Spiegazione del prezzo | ||
| Linee guida per le imprese aziendali | ||
| Raccomandazioni su date di soggiorno alternative | ||
| Raccomandazioni di proprietà alternative | ||
| Ottimizzazione dei prezzi in tempo reale | ||
| Controllo dinamico della gerarchia dei prezzi | ||
| Prezzi aperti | ||
| Flussi di lavoro guidati | ||
| Analisi dello scenario "What-if" | ||
| Prezzi dinamici | ||
| Set Boundaries | ||
| Manage Exceptions | ||
| Group Pricing | ||
| Manage Restrictions | ||
| Manage Sell-Outs & Cancellations | ||
| Business Mix Optimization | ||
| Define Cycles | ||
| Yield Room Types Individually | ||
| Bulk Adjustments | ||
| Prezzi e previsioni a 24 mesi | ||
| Prezzi dei componenti/stanze virtuali | ||
| Prezzi per soggiorni prolungati | ||
| Prezzi di upsell | ||
| Tasso di ostacolo | ||
|
▾
Informazioni e previsioni di mercato
|
|
|
| Previsioni quinquennali | ||
| Prezzi a termine di 365 giorni | ||
| STR Data | ||
| 18-Month Forward Pricing | ||
| Modellazione della sensibilità al prezzo | ||
| Multi-Property Dashboard | ||
| Market Intelligence Data | ||
| Interactive Customizable Dashboards | ||
| Dati sulla domanda futura del mercato | ||
| Costruttore di previsioni finanziarie | ||
| Previsione di soggiorno prolungato | ||
| Previsione del canale | ||
| Spiegazione delle previsioni | ||
| Dati flessibili sui concorrenti | ||
|
▾
Dashboard e reportistica
|
|
|
| Rapporti personalizzati | ||
| Rapporti programmati | ||
| Dati aziendali persi | ||
| Dashboard di analisi | ||
| Interactive Customizable Dashboards | ||
| Market Insights Reporting | ||
| Pickup Analysis | ||
| Booking Pattern Analysis | ||
| Event Data | ||
| Price Change Logs | ||
| Customizable Notifications & Alerts | ||
| Displacement Analysis | ||
| Group Pricing & Evaluation | ||
| Multi-Property Dashboard | ||
| Misurazione dei benefici del sistema | ||
|
▾
Automazione
|
|
|
| Controlled Automation/Algorithm Customization | ||
| Prezzi automatizzati per tipo di camera | ||
| Gestione delle entrate completamente automatizzata | ||
| Prezzi dinamici | ||
| AI Optimization | ||
| Automatic Pricing Updates | ||
|
▾
Funzionalità multiproprietà
|
|
|
| Gestione delle scorte | ||
| Gestione multiproprietà | ||
| Multi-Property Dashboard | ||
|
▾
Affari di gruppo
|
|
|
| Group Pricing & Evaluation | ||
| Analisi dello scenario "What-if" | ||
| Displacement Analysis | ||
| Previsione e lavaggio del gruppo | ||
|
▾
Integrazioni
|
|
|
| Apri API | ||
| Gestione del canale | ||
| Business Intelligence | ||
| STR Data | ||
| Property Management System | ||
| Autenticazione multifattoriale | ||
|
▾
Other
|
|
|
| Prezzi e valutazione di gruppo | ||
| App per dispositivi mobili | ||
| Tecnologia di diffusione intelligente | ||
| Single Sign-On | ||
| Design ottimizzato per dispositivi mobili |
Risultati Reali: Climber a Revenue Analytics Company vs hotellab per Obiettivo di Business
Abbiamo analizzato 3 casi studio verificati per confrontare cosa gli hotel ottengono realmente con ciascuna piattaforma su quattro obiettivi di business chiave.
Climber a Revenue Analytics Company
Nessun caso studio ancora pubblicato per questo obiettivo.
Bella Vista
Piccolo
"We implemented hotellab in the middle of summer - the busiest time of the year. Within weeks, I could see the difference. The system worked for me, not the other way around."

Climber a Revenue Analytics Company vs hotellab: Il Verdetto Finale
Funzionalità uniche
Cosa amano gli albergatori
Hotellab RMS si dimostra estremamente efficace nell'incrementare l'ADR (tariffa media giornaliera), il tasso di occupazione e il fatturato complessivo... Hotellab RMS si dimostra estremamente efficace nell'incrementare l'ADR (tariffa media giornaliera), il tasso di occupazione e il fatturato complessivo. Numerose recensioni confermano i significativi miglioramenti in questi indicatori, attribuendoli alle funzionalità di prezzi dinamici e di previsione strategica del sistema.
Alcuni utenti di strutture ricettive più piccole esprimono la necessità di opzioni di reporting più personalizzate e semplificate, suggerendo che dete... Alcuni utenti di strutture ricettive più piccole esprimono la necessità di opzioni di reporting più personalizzate e semplificate, suggerendo che determinate funzionalità siano più adatte agli hotel di grandi dimensioni. Soluzioni personalizzate potrebbero migliorare l'usabilità per questo segmento di clientela.
Le funzionalità di automazione di Hotellab, tra cui Autopilot, sono apprezzate per la riduzione delle attività manuali e la gestione sicura delle modi... Le funzionalità di automazione di Hotellab, tra cui Autopilot, sono apprezzate per la riduzione delle attività manuali e la gestione sicura delle modifiche ai prezzi. Gli utenti sottolineano la capacità dello strumento di rispondere ai cambiamenti del mercato in modo rapido ed efficiente.
Classificato più in alto per
Funzionalità uniche
Domande Frequenti su Climber, a Revenue Analytics Company vs hotellab
Climber, a Revenue Analytics Company può sostituire hotellab?
Dipende dalle tue esigenze. Climber, a Revenue Analytics Company e hotellab condividono molte funzionalità di base di Revenue Management Systems, ma ciascuno ha capacità uniche. Climber, a Revenue Analytics Company offre 7 partner di integrazione verificati, mentre hotellab ne offre 13. Consulta il confronto delle funzionalità sopra per vedere dove differiscono prima di cambiare.
Qual è migliore per hotel piccoli o indipendenti?
Gli hotel piccoli dovrebbero dare priorità alla facilità d'uso e a un onboarding rapido. Climber, a Revenue Analytics Company è in testa per facilità d'uso con 4.9/5 vs 4.9/5. Cerca prezzi trasparenti e un'opzione di prova o demo. Filtra le recensioni su ogni pagina prodotto per dimensione della struttura per sentire le opinioni di hotel simili al tuo.
Climber, a Revenue Analytics Company o hotellab offrono un piano gratuito?
Climber, a Revenue Analytics Company: No. hotellab: No. Nessuno dei due prodotti offre attualmente un livello gratuito. La maggior parte dei fornitori di Revenue Management Systems offre demo o prove gratuite — richiedine una a ciascuno per valutare prima di impegnarti.
Come Valuta e Classifica HTR Climber, a Revenue Analytics Company e hotellab?
L'HT Score è una classifica composita che considera 4 gruppi di criteri e oltre una dozzina di variabili per aiutare gli albergatori a confrontare oggettivamente i prodotti tecnologici per hotel. Climber a Revenue Analytics Company ha un HT Score di 0 e hotellab ha 87. Ecco come viene calcolato il punteggio.
| Gruppo di Criteri | Peso | Cosa Misura |
|---|---|---|
| Valutazioni e Recensioni dei Clienti |
|
Quanto raccomandano gli utenti questo prodotto? Punteggio Valutazioni, Volume Recensioni, Quota di Voce, Profondità Recensioni, Recenza Recensioni, Storie di Successo ▾ Il fattore con il peso maggiore. Analizza le valutazioni medie di soddisfazione (probabilità di raccomandazione, facilità d'uso, assistenza, ROI), il numero totale di recensioni rispetto ai concorrenti nella categoria, la recenza delle recensioni (almeno 20 recensioni negli ultimi 6 mesi) e la quota di voce tra clienti hotel unici per rilevare bias di selezione. |
| Ecosistema dei Partner |
|
Quanto raccomandano i partner tecnologici questa azienda? Raccomandazioni dei Partner, Quantità Integrazioni, Qualità Integrazioni ▾ Valuta le raccomandazioni dei partner come voti di fiducia degli esperti, il numero di integrazioni verificate e la qualità dell'ecosistema — la media degli HT Score dei partner di integrazione. I prodotti con ecosistemi di integrazione di qualità superiore hanno maggiori probabilità di offrire uno stack tecnologico connesso. |
| Centralità del Cliente |
|
Quanto è orientata al cliente questa organizzazione? Assistenza Certificata, Coerenza delle Recensioni, Completezza del Profilo ▾ Valuta se l'azienda ha ottenuto la Certificazione di Assistenza Clienti HTR, mantiene una raccolta di recensioni costante nel tempo (un indicatore di cultura orientata al feedback) e mantiene i profili prodotto completi con funzionalità, screenshot, prezzi e caratteristiche. |
| Portata, Solidità e Risorse |
|
Quanto sono estese la portata e le risorse di questa azienda? Portata Geografica, Solidità nel Tempo, Risorse Aziendali, Punteggio di Tendenza ▾ Misura la presenza globale (paesi e regioni servite), gli anni di attività come indicatore di stabilità, il numero di dipendenti come indicatore di risorse e un punteggio di tendenza basato su richieste degli acquirenti, recensioni, raccomandazioni dei partner e attività stampa degli ultimi dodici mesi. |
Le valutazioni e le recensioni dei clienti sono di gran lunga il fattore più importante nell'algoritmo dell'HT Score. HTR non accetta pagamenti per classifiche più alte. Tutte le recensioni sono verificate — solo i professionisti del settore alberghiero con affiliazioni confermate possono inviare valutazioni. Visualizza la metodologia completa dell'HT Score →
Quali Altri Confronti di Sistemi di gestione delle entrate Stanno Leggendo gli Albergatori?
Esplora altri confronti diretti basati su recensioni verificate di albergatori.




Ottieni il tuo report gratuito di analisi AI
Consigli personalizzati su misura per la tua struttura


Cerchiamo le informazioni sul tuo hotel
Stai ancora valutando le tue opzioni di sistemi di gestione delle entrate?
Alcuni sistemi popolari dalla nostra guida su sistemi di gestione delle entrate — oppure lascia che la nostra IA valuti ciascuno di essi in base alla tua struttura in circa due minuti.


