

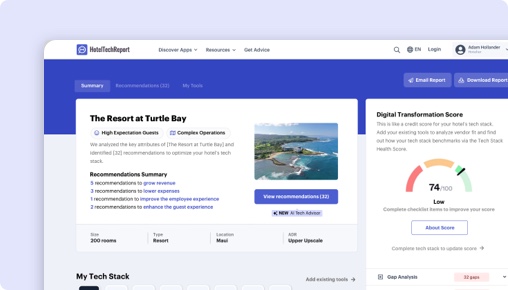
Désolé, cette fonctionnalité est réservée aux hôteliers vérifiés
Le tableau de bord des projets est un outil gratuit réservé aux hôteliers vérifiés. Il facilite l'adoption de nouvelles technologies en rationalisant leurs recherches et en simplifiant leurs échanges.

Benchmarking Alliance vs. ProfitSword by Actabl:
Lequel vous convient le mieux ?


TLDR
Nous avons analysé 517 avis vérifiés d'hôteliers, comparé les fonctionnalités, les tarifs et des études de cas réelles pour identifier les points forts de chaque plateforme. Le bon choix dépend de votre type d'hôtel et de vos priorités :
Benchmarking Alliance se distingue , avec des fonctionnalités exclusives comme Pricing Decision Impact Tracking and Shared Demand Calendar.
Actabl se distingue sur ease of use and customer support — en particulier sur le segment brand (4.9/5) , avec des fonctionnalités exclusives comme Daily Reporting and Financial Reporting.
Comment Benchmarking Alliance se compare-t-il à ProfitSword by Actabl ?
Notes comparées basées sur 517 avis vérifiés d'hôteliers sur HTR.
| HTScore |
|
|
| Probabilité de recommandation |
|
|
| Facilité d'utilisation |
|
|
| Support client |
|
|
| Rapport qualité-prix |
|
|
| Prix de départ | Dès 100 $/mois | Dès 1,000 $/mois |
| Avis vérifiés | 0 | 517 |
Quels sont les avantages et inconvénients de Benchmarking Alliance vs ProfitSword by Actabl ?
Après analyse de 517 avis vérifiés, les utilisateurs de Benchmarking Alliance apprécient surtout , tandis que ceux de Actabl mettent en avant customizability and flexibility, dashboards and visualization, data integration. Cliquez sur un thème pour voir ce que disent les évaluateurs.
|
Benchmarking Alliance
|
Actabl
|
|---|---|
| Avantages | |
|
+
Customizability and Flexibility
▾
|
|
|
+
Dashboards and Visualization
▾
|
|
|
+
Data Integration
▾
|
|
|
+
Revenue Management
▾
|
|
| Inconvénients | |
|
−
System Performance
▾
|
|
|
−
Training and Support
▾
|
|
|
−
Errors and Data Accuracy
▾
|
|
Benchmarking Alliance vs Actabl : Classement par segment hôtelier
Comment chaque produit se classe parmi les fournisseurs Veille stratégique pour différentes tailles d'établissement, types et régions — basé sur les avis vérifiés d'hôteliers dans chaque segment.
Par taille d'hôtel
| Segment |
Benchmarking Alliance
|
Actabl
|
|---|---|---|
| Petit (10-24 chambres) ▾ | — | #2 33 avis |
| Moyen (25-74 chambres) ▾ | — | #1 256 avis |
| Grand (75-199 chambres) ▾ | — | #2 132 avis |
| Très grand (200+ chambres) ▾ | — | #1 69 avis |
Par type d'hôtel
| Segment |
Benchmarking Alliance
|
Actabl
|
|---|---|---|
| Boutique ▾ | — | #1 202 avis |
| Luxe ▾ | — | #2 134 avis |
| Enseigne / Chaîne ▾ | — | #1 392 avis |
| Séjour prolongé ▾ | — | #1 76 avis |
Par région
| Segment |
Benchmarking Alliance
|
Actabl
|
|---|---|---|
| Amérique du Nord ▾ | — | #1 486 avis |
| Europe ▾ | — | #12 9 avis |
| Asie-Pacifique ▾ | — | #6 5 avis |
| Moyen-Orient | — | #5 4 avis |
The Decision
Choosing between Benchmarking Alliance and ProfitSword by Actabl ultimately hinges on your hotel’s specific needs for business intelligence. Both products aim to improve performance through data insights, but they differ significantly in scope, user experience, and market presence. Understanding their core capabilities will help you determine which aligns best with your operational goals.
Benchmarking Alliance provides specialized regional benchmarking data, primarily for hotels seeking competitive insights. ProfitSword, on the other hand, offers a comprehensive suite of financial and operational analytics with a broader global footprint. Which of these platforms will empower your team to make smarter decisions faster?
Is Benchmarking Alliance or ProfitSword Better for Hotels?
Benchmarking Alliance is dedicated to delivering precise competitive benchmarks, especially in the Nordics and Baltics, with daily data from over 2,500 hotels. ProfitSword focuses on transforming hotel data into actionable insights through real-time reporting, forecasting, and budgeting, with integrations across hundreds of applications.
While Benchmarking Alliance excels at providing high-quality, regional KPIs for competitive analysis, ProfitSword offers more extensive features for day-to-day operational decision-making. Both platforms aim to increase revenue, but their approaches and data sources diverge sharply. Do you need regional benchmarks or a broader operational analytics tool?
ProfitSword vs Benchmarking Alliance: Which Should Your Hotel Choose?
If your hotel needs detailed competitor benchmarks and regional market insights, Benchmarking Alliance is your pick, especially if you operate in Europe or the Nordics. Its focus on daily regional data makes it ideal for hotels that want to monitor market share and performance against local competitors.
Conversely, if your hotel requires an all-in-one financial management and operational analytics platform, ProfitSword is the superior option. Its robust tools for forecasting, budgeting, revenue management, and integration with PMS systems serve hotels aiming for comprehensive performance management. For multi-property chains needing customizable reports and real-time data, ProfitSword is the recommended choice.
Is Benchmarking Alliance or ProfitSword Easier to Use?
Benchmarking Alliance scores a 0/5 in ease of use, reflecting its niche focus and less intuitive interface, which can pose onboarding challenges. Its specialized data may require more training to interpret, especially for teams unfamiliar with regional KPIs.
ProfitSword, rated 4.65/5 for ease of use, is praised for its user-friendly dashboards, modern interface, and smooth onboarding processes. Many users highlight its straightforward navigation and customizable reports that simplify complex data analysis.
Edge: ProfitSword.
Which Has Better Features: Benchmarking Alliance or ProfitSword?
Benchmarking Alliance offers 14 shared features plus 3 unique ones like Pricing Decision Impact Tracking and In-App Data Management, mainly focused on benchmark comparisons and demand calendars.
ProfitSword boasts 21 exclusive features, including Daily Reporting, PMS Mapping, Accounts Payable, Budgeting, Forecasting, Custom Reports & Templates, Alerts Feed, and Profitability by Customer. Its extensive feature set supports operational, financial, and strategic decision-making on a granular level.
Edge: ProfitSword.
Which Has Better Customer Support: Benchmarking Alliance or ProfitSword?
Benchmarking Alliance's support data is unavailable, and reviews do not mention their customer service experience, suggesting limited or unpublicized support resources.
ProfitSword benefits from a 4.55/5 customer support rating, with users praising prompt responses, ongoing support, and the responsiveness of their dedicated team. One review notes that their support staff is "very responsive and helpful," easing onboarding and troubleshooting.
Edge: ProfitSword.
Which Has More Integrations: Benchmarking Alliance or ProfitSword?
Benchmarking Alliance integrates with 19 verified partners, including Juyo Analytics, Fairmas, VISIT, and Sirvoy, focusing on hospitality-specific tools.
ProfitSword far exceeds this with 100 verified integrations, including major PMS systems like Innspire, MSI Solutions, Birchstreet, and STR. Its open API and extensive connectivity enable seamless data flow across operational and financial systems.
Edge: ProfitSword.
Which Do Hoteliers Rate Higher: Benchmarking Alliance or ProfitSword?
Since Benchmarking Alliance has no recent reviews or ratings, it’s impossible to determine user sentiment. ProfitSword, with 449 reviews and a 4.74/5 overall rating, is favored across property types, especially branded hotels (4.88/5) and independent hotels (4/5).
Recent reviews describe ProfitSword as "a game changer," with high praise for its usability, support, and comprehensive features. Its 94% likelihood to recommend indicates strong satisfaction among users.
Edge: ProfitSword.
How Much Do Benchmarking Alliance and ProfitSword Cost?
Benchmarking Alliance costs $100 per month, with no free trial or implementation fees, making it an affordable option focused on benchmarking.
ProfitSword’s base price is $1,000 monthly, with no trial period, reflecting its broader feature set and extensive integrations. Its higher cost corresponds with its comprehensive performance management capabilities.
What Type of Hotel Should Use Benchmarking Alliance?
- Hotels that operate primarily in Europe or the Nordics, aiming to compare their performance against regional competitors.
- Teams that need reliable, daily benchmarking data to inform revenue strategies.
- Hotels with limited budgets seeking targeted insights without extensive operational analytics.
- Hotels that prioritize market share monitoring over internal financial management.
Not ideal if your hotel seeks detailed operational analytics, forecasting, or customization beyond benchmarking.
What Type of Hotel Should Use ProfitSword?
- Hotels of all sizes seeking detailed, real-time financial and operational insights.
- Hotel chains that want customizable reports and integrations with existing management systems.
- Teams focused on forecasting, budgeting, revenue optimization, and labor management.
- Hotels across multiple regions, thanks to its extensive global integration footprint.
Not ideal if your hotel only needs basic benchmarking or has minimal reliance on integrated data systems.
ProfitSword vs Benchmarking Alliance: The Bottom Line for Hotels
The core difference lies in scope: Benchmarking Alliance specializes in regional benchmarking and competitive insights, while ProfitSword covers a broad spectrum of operational and financial analytics.
Choose Benchmarking Alliance if your priority is understanding your position in specific markets, especially in Europe, with quick, focused benchmarks. Opt for ProfitSword if your hotel aims to streamline decision-making through detailed reports, forecasting, and system integrations for a comprehensive view.
For hotels with large portfolios or those requiring adaptable, automated reporting, ProfitSword’s extensive feature set and integrations make it the clear winner. However, if your focus is competitive positioning in Nordic regions, Benchmarking Alliance provides a targeted, cost-effective solution.
In summary:
- If your hotel needs a dedicated benchmarking tool with regional insights, go with Benchmarking Alliance.
- For a full-featured BI platform that supports operational, financial, and strategic decisions, ProfitSword is the stronger choice.
- The more recent reviews, higher rating, and wider adoption favor ProfitSword, making it the recommended option for most hotels seeking comprehensive business intelligence.
Combien coûtent Benchmarking Alliance et ProfitSword by Actabl ?
La tarification des Veille stratégique est rarement simple. Voici ce que nous savons à partir des données tarifaires publiques de chaque fournisseur. Demandez toujours un devis personnalisé pour la taille de votre établissement.
|
Benchmarking Alliance
|
Actabl
|
|
|---|---|---|
| Prix de départ | Dès 100 $/mois | Dès 1,000 $/mois |
Comparaison des fonctionnalités : Benchmarking Alliance vs ProfitSword by Actabl
Voici les fonctionnalités configurées par chaque fournisseur, organisées par groupe de fonctionnalités — les mêmes données que dans le tableau de bord du fournisseur. Développez un groupe pour comparer les fonctionnalités côte à côte.
| Fonctionnalité |
Benchmarking Alliance
|
Actabl
|
|---|---|---|
|
▾
Analytique
|
|
|
| Rapports et modèles personnalisés | ||
| Net Revenue KPIs | ||
| Autres prévisions, rapports et analyses de revenus | ||
| Rapports, analyses et prévisions sur les aliments et les boissons | ||
| Suivi de compte d'entreprise et d'agence de voyages | ||
| Tableau de bord analytique | ||
| Suivi de la productivité de l'équipe de vente | ||
| Rythme des revenus | ||
| Tableau de bord et visualisation des données | ||
| Distribution Cost Analytics | ||
| Rapports programmés | ||
| Suivi multi-propriétés et au niveau du portefeuille | ||
| Suivi de l'impact des décisions de tarification | ||
| Contribution à la rentabilité du client | ||
| Calendrier de demande partagé | ||
| Regroupement de portefeuille flexible | ||
| Intelligence artificielle | ||
|
▾
Prévisions, budgétisation et planification
|
|
|
| Rythme des revenus | ||
| Verrouillage des prévisions et flux de travail | ||
| Modèles basés sur le conducteur | ||
| Rapports, analyses et prévisions sur les aliments et les boissons | ||
| Autres prévisions, rapports et analyses de revenus | ||
| Plans d'affaires et de marketing | ||
| Contrôle de version | ||
| Basé sur le Web | ||
| Suivi de l'impact des décisions de tarification | ||
| Calendrier de demande partagé | ||
| Regroupement de portefeuille flexible | ||
|
▾
Gestion de données
|
|
|
| Gestion multi-propriétés | ||
| Gestion centralisée des utilisateurs et des rôles | ||
| API ouverte | ||
| Collecte et intégration de données automatisées | ||
| Hiérarchies de données personnalisables | ||
| Gestion des données intégrées à l'application | ||
| Regroupement de portefeuille flexible | ||
|
▾
Collaboration
|
|
|
| Collaboration et commentaires | ||
| Modèles et plans partageables | ||
| Pièces jointes | ||
| Basé sur le Web | ||
| Flux d'alertes |
Résultats concrets : Benchmarking Alliance vs Actabl par objectif commercial
Nous avons analysé 2 études de cas vérifiées pour comparer ce que les hôtels obtiennent réellement avec chaque plateforme sur quatre objectifs commerciaux clés.
Benchmarking Alliance
Aucune étude de cas publiée pour cet objectif pour le moment.
Onvo
Petit
"Labor is such a fast-moving category, so looking at performance after a month doesn't work. We monitor labor costs every day, for every property. I get a report, and our team works..."
 Benchmarking Alliance
Aucune étude de cas publiée pour cet objectif pour le moment.
Cote Hospitality
Petit
"Thanks to Actabl, we've chosen partners not just vendors. ProfitSword has enabled us to have more clarity into what truly matters most. And that is what's going to happen the next..."

Benchmarking Alliance vs Actabl : Le verdict final
Fonctionnalités uniques
Ce que les hôteliers apprécient
The system allows flexible reporting and data display, which users find essential for tailoring insights to specific departmental needs. However, more... The system allows flexible reporting and data display, which users find essential for tailoring insights to specific departmental needs. However, more efficient navigation and expanded customization options could enhance usability.
ProfitSword offers highly customizable and intuitive dashboards, which users find beneficial for visualizing complex datasets and facilitating data-dr... ProfitSword offers highly customizable and intuitive dashboards, which users find beneficial for visualizing complex datasets and facilitating data-driven decision-making. However, some desire enhancements in user interface modernity and mobile usability.
ProfitSword effectively consolidates data from multiple sources such as PMS and CRM, providing a holistic view of hotel operations. This integration s... ProfitSword effectively consolidates data from multiple sources such as PMS and CRM, providing a holistic view of hotel operations. This integration supports strategic decision-making by reducing manual data entry and improving data accessibility.
Les points de friction pour les hôteliers
Users have expressed the need for improved system performance, particularly regarding server speed and reliability, as slow load times can hinder acce... Users have expressed the need for improved system performance, particularly regarding server speed and reliability, as slow load times can hinder access to time-sensitive data. Faster load times and better uptime would enhance user experience.
While ProfitSword is generally easy to onboard due to its intuitive interface, some users have called for more comprehensive training materials and re... While ProfitSword is generally easy to onboard due to its intuitive interface, some users have called for more comprehensive training materials and responsive support services to ease the learning curve of advanced features.
Fonctionnalités uniques
Où les notes divergent le plus
Questions fréquentes sur Benchmarking Alliance vs ProfitSword by Actabl
Benchmarking Alliance peut-il remplacer ProfitSword by Actabl ?
Cela dépend de vos besoins. Benchmarking Alliance et ProfitSword by Actabl partagent de nombreuses fonctionnalités Business Intelligence de base, mais chacun a des capacités uniques. Benchmarking Alliance propose 18 partenaires d'intégration vérifiés, tandis que ProfitSword by Actabl en propose 99. Consultez la comparaison des fonctionnalités ci-dessus pour voir les différences avant de changer.
Lequel est le mieux adapté aux petits hôtels ou hôtels indépendants ?
Les petits hôtels devraient privilégier la facilité d'utilisation et une prise en main rapide. ProfitSword by Actabl est en tête pour la facilité d'utilisation avec 4.7/5 contre 0.0/5. Recherchez une tarification transparente et une option d'essai ou de démonstration. Filtrez les avis sur chaque page produit par taille d'établissement pour lire les retours d'hôtels similaires au vôtre.
Benchmarking Alliance ou ProfitSword by Actabl proposent-ils une offre gratuite ?
Benchmarking Alliance : Non. ProfitSword by Actabl : Non. Aucun des deux produits ne propose actuellement d'offre gratuite. La plupart des fournisseurs Business Intelligence proposent des démonstrations ou des essais — demandez-en un à chacun pour évaluer avant de vous engager.
Comment HTR évalue-t-il et classe-t-il Benchmarking Alliance et ProfitSword by Actabl ?
Le HT Score est un classement composite qui prend en compte 4 groupes de critères et plus d'une douzaine de variables pour aider les hôteliers à comparer objectivement les produits technologiques hôteliers. Benchmarking Alliance a un HT Score de 0 et Actabl a 89. Voici comment le score est calculé.
| Groupe de critères | Pondération | Ce qu'il mesure |
|---|---|---|
| Notes et avis clients |
|
À quel point les utilisateurs recommandent-ils ce produit ? Score des notes, Volume d'avis, Part de voix, Profondeur des avis, Récence des avis, Cas de réussite ▾ Le facteur le plus fortement pondéré. Analyse les notes de satisfaction moyennes (probabilité de recommandation, facilité d'utilisation, support, ROI), le nombre total d'avis par rapport aux pairs de la catégorie, la récence des avis (au moins 20 avis sur les 6 derniers mois) et la part de voix parmi les clients hôteliers uniques pour détecter les biais de sélection. |
| Écosystème partenaire |
|
À quel point les partenaires technologiques recommandent-ils cette entreprise ? Recommandations des partenaires, Nombre d'intégrations, Qualité des intégrations ▾ Évalue les recommandations des partenaires comme des votes de confiance d'experts, le nombre d'intégrations vérifiées et la qualité de l'écosystème — la moyenne des HT Scores des partenaires d'intégration. Les produits avec des écosystèmes d'intégration de meilleure qualité sont plus susceptibles de fournir un stack technologique connecté. |
| Orientation client |
|
À quel point cette organisation est-elle orientée client ? Support certifié, Régularité des avis, Complétude du profil ▾ Évalue si l'entreprise a obtenu la certification HTR de support client, maintient une collecte d'avis régulière dans le temps (un indicateur de culture axée sur le feedback) et tient à jour les profils produits avec les fonctionnalités, captures d'écran, tarifs et caractéristiques. |
| Portée, pérennité et ressources |
|
Quelle est l'étendue de la portée et des ressources de cette entreprise ? Portée géographique, Pérennité, Ressources de l'entreprise, Score de tendance ▾ Mesure la présence mondiale (pays et régions desservis), les années d'activité comme indicateur de stabilité, les effectifs comme indicateur de ressources, et un score de tendance basé sur les demandes d'acheteurs, les avis, les recommandations de partenaires et l'activité presse des douze derniers mois. |
Les notes et avis clients sont de loin le facteur le plus important dans l'algorithme du HT Score. HTR n'accepte aucun paiement pour un meilleur classement. Tous les avis sont vérifiés — seuls les professionnels du secteur hôtelier avec des affiliations confirmées peuvent soumettre des notes. Voir la méthodologie complète du HT Score →
Quelles autres comparaisons Veille stratégique les hôteliers consultent-ils ?
Explorez d'autres comparaisons directes basées sur les avis vérifiés d'hôteliers.





Sommaire
Obtenez votre rapport d'analyste IA gratuit
Recommandations personnalisées adaptées à votre établissement


