

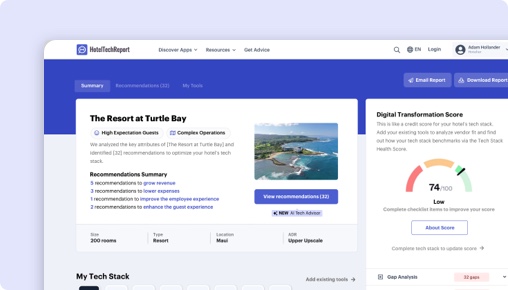
Spiacenti, questa funzionalità è disponibile solo per gli albergatori verificati
La dashboard dei progetti è uno strumento gratuito disponibile solo per gli albergatori verificati, che semplifica l'adozione di nuove tecnologie snellendo la ricerca e i flussi di comunicazione.

Benchmarking Alliance vs. M3 (Insight):
Qual è Quello Giusto per Te?


TLDR
Abbiamo analizzato 274 recensioni verificate di albergatori, confrontato funzionalità, prezzi e casi studio reali per evidenziare dove ciascuna piattaforma eccelle. La scelta giusta dipende dal tipo di hotel e dalle tue priorità:
Benchmarking Alliance eccelle , con funzionalità esclusive come Shared Demand Calendar.
M3 eccelle in ease of use and customer support — soprattutto nel segmento brand (4.1/5) , con funzionalità esclusive come Daily Reporting and Financial Reporting.
Come si Confronta Benchmarking Alliance con M3 (Insight)?
Valutazioni fianco a fianco basate su 274 recensioni verificate di albergatori su HTR.
| HTScore |
|
|
| Probabilità di Raccomandazione |
|
|
| Facilità d'Uso |
|
|
| Assistenza Clienti |
|
|
| Rapporto Qualità-Prezzo |
|
|
| Prezzo di Partenza | Da $100/mese | Da $300/mese |
| Recensioni Verificate | 0 | 274 |
Quali Sono i Pro e i Contro di Benchmarking Alliance vs M3 (Insight)?
Dopo aver analizzato 274 recensioni verificate, gli utenti di Benchmarking Alliance apprezzano maggiormente , mentre gli utenti di M3 evidenziano processo di accesso sicuro e semplice, recupero efficiente dei report. Clicca su qualsiasi tema per vedere cosa dicono i recensori.
|
Benchmarking Alliance
|
M3
|
|---|---|
| Pro | |
|
+
Processo di accesso sicuro e semplice
▾
|
|
|
+
Recupero efficiente dei report
▾
|
|
| Contro | |
Benchmarking Alliance vs M3: Classifiche per Segmento Alberghiero
Come si classifica ciascun prodotto tra i fornitori di Business Intelligence per diverse dimensioni di struttura, tipologie di hotel e regioni — basato su recensioni verificate di albergatori in ogni segmento.
Per Dimensione Hotel
| Segmento |
Benchmarking Alliance
|
M3
|
|---|---|---|
| Piccolo (10-24 camere) ▾ | — | #6 13 recensioni |
| Medio (25-74 camere) ▾ | — | #3 171 recensioni |
| Grande (75-199 camere) ▾ | — | #4 39 recensioni |
| Extra-Grande (200+ camere) ▾ | — | #5 19 recensioni |
Per Tipo di Hotel
| Segmento |
Benchmarking Alliance
|
M3
|
|---|---|---|
| Boutique ▾ | — | #3 107 recensioni |
| Lusso ▾ | — | #5 53 recensioni |
| Brand / Catena ▾ | — | #3 180 recensioni |
| Soggiorno Prolungato ▾ | — | #3 30 recensioni |
Per Regione
| Segmento |
Benchmarking Alliance
|
M3
|
|---|---|---|
| Nord America ▾ | — | #2 241 recensioni |
| Europa | — | #25 2 recensioni |
| Asia Pacifico ▾ | — | #17 5 recensioni |
| Medio Oriente | — | #15 0 recensioni |
The Decision
Choosing the right business intelligence platform for your hotel hinges on understanding each product’s core strengths and how they align with your operational needs. Benchmarking Alliance by Benchmarking Alliance focuses on providing detailed competitor benchmarks to boost revenue, primarily in the Nordic and Baltic regions. Conversely, M3 (Insight) from M3 offers a broad suite of analytics, financial management, and operational tools with extensive integration options, mainly serving the North American market.
Both products aim to help you make data-driven decisions, but they do so through different lenses. Benchmarking Alliance emphasizes comparative performance metrics, while M3 provides a comprehensive analytics ecosystem. Are you prioritizing regional benchmarking accuracy or integrated operational insights?
Is Benchmarking Alliance or M3 Better for Hotels?
Benchmarking Alliance specializes in delivering precise, competitive benchmarks based on data from over 2,500 hotels, predominantly in Europe. Your team will find it invaluable if your focus is on understanding how your property stacks against regional competitors to identify revenue opportunities. However, its limited feature set—only 16 shared features—means it lacks operational tools like budgeting or forecasting, which are more robust in M3.
M3, with a review count of 237 and recent reviews in the last six months, boasts a 4.16/5 overall rating and a 92.5/100 HTR score, indicating a more reliable and current user experience. Its extensive feature set and higher customer satisfaction make it the stronger choice if you need a full operational BI platform. Do you need in-depth benchmarking or a broader operational toolkit?
M3 vs Benchmarking Alliance: Which Should Your Hotel Choose?
If your hotel needs precise regional performance benchmarks to inform revenue management strategies, Benchmarking Alliance is a compelling choice due to its specialized focus and regional coverage. Its core offering of competitor KPIs helps you identify market gaps and optimize pricing strategies effectively.
On the other hand, if you require a robust, all-in-one BI solution that covers financial reporting, forecasting, labor management, and integration with industry data sources, M3 is the better fit. Its 31 unique features, including daily reporting, general ledger, and forecasting, serve hotels looking for comprehensive operational insights.
Hotels in Europe aiming for regional benchmarking should lean toward Benchmarking Alliance. Hotels seeking a broader, integrated solution suited for North American markets and larger portfolios should prioritize M3.
Is Benchmarking Alliance or M3 Easier to Use?
Benchmarking Alliance does not provide extensive user experience data but, given its narrow focus, is likely straightforward for users primarily interested in benchmarking metrics. M3, rated 4.46/5 for ease of use based on 237 reviews, impresses with its intuitive dashboard, secure login, and quick report retrieval. Users praise its straightforward navigation and efficient onboarding, with a review stating, "Support at M3 is always quick and personal with follow-up throughout the process."
Edge: M3.
Which Has Better Features: Benchmarking Alliance or M3?
Benchmarking Alliance offers only 16 shared features, including competitor KPIs and demand calendars, making it suitable for benchmarking but limited in operational functions. M3, with 31 features, surpasses this by including daily reporting, general ledger, budgeting, forecasting, labor standards, report writer, and API access.
The additional capabilities in M3 enable comprehensive management of hotel finances, labor, and performance data, whereas Benchmarking Alliance stays focused on performance comparison. If your hotel needs a full operational BI suite, M3’s feature set clearly delivers more value.
Edge: M3.
Which Has Better Customer Support: Benchmarking Alliance or M3?
While Benchmarking Alliance’s support ratings are unavailable, M3's user feedback highlights its support team as prompt and personable, with an average rating of 4.48/5. Reviewers appreciate quick responses and ongoing follow-up, describing support as "support at M3 is always quick and personal." This consistency enhances onboarding and daily use.
Given the lack of support data for Benchmarking Alliance, the clear choice is M3, backed by positive recent reviews. Support quality significantly impacts operational continuity and ease of use.
Edge: M3.
Which Has More Integrations: Benchmarking Alliance or M3?
Benchmarking Alliance integrates with 19 verified partners, including Juyo Analytics and VISIT, focusing on niche industry integrations. M3 offers 39 verified partners, including major property management systems like Mews, STR, InnRoad, and Birchstreet, providing a broader set of integration options for operational data.
The extensive integration network in M3 allows your hotel to connect with essential industry tools, feeding comprehensive data into its analytics environment. If seamless system interoperability is critical, M3’s integrations outperform those of Benchmarking Alliance.
Edge: M3.
Which Do Hoteliers Rate Higher: Benchmarking Alliance or M3?
Since Benchmarking Alliance has no reviews listed, we rely on M3’s data—237 reviews with a 4.16/5 overall rating. Hotels across various segments praise M3 for its ease of use, support, and feature richness, especially in North American markets.
In recent reviews, properties value M3’s ability to consolidate data and provide actionable insights, with quotes like, "Insight's ability to integrate with third-party data is important because owners want to see more than just revenue from the day." M3’s high review count and recent feedback make it the more trusted choice among hoteliers.
Edge: M3.
How Much Do Benchmarking Alliance and M3 Cost?
Benchmarking Alliance’s pricing begins at $100 per month, with no free trial or tiered options mentioned. M3’s base price is $300 per month, also without a trial, reflecting its broader feature set and integrations.
While Benchmarking Alliance offers a lower entry point, its limited features might justify the higher investment in M3 if your hotel needs operational insights as well as benchmarking. Cost should be weighed against the value of the deeper capabilities.
What Type of Hotel Should Use Benchmarking Alliance?
Hotels that primarily focus on regional revenue benchmarking to refine pricing and market positioning will benefit from Benchmarking Alliance’s detailed competitor data. Teams that want clear, region-specific insights into market performance without needing extensive operational tools are ideal users.
Not ideal if your hotel requires comprehensive financial management, forecasting, or labor tools, as Benchmarking Alliance’s limited feature set doesn’t support these needs. It’s better suited for hotels aiming to refine revenue strategies through competitive benchmarking alone.
- Hotels that want to compare KPIs against regional competitors
- Teams focused on revenue maximization through benchmarking
- Hotels with a regional, Nordic, or Baltic presence
Not ideal if your hotel needs integrated financial, forecasting, or operational tools. Larger portfolios or North American-focused properties should consider M3 instead.
What Type of Hotel Should Use M3?
Hotels seeking a full-featured business intelligence platform to manage finances, labor, and operational data should choose M3. It is also well-suited for hotels with complex reporting needs, such as daily operational dashboards, forecasting, and integration with third-party data sources.
Not ideal if your hotel only requires benchmarking data or operates in a limited regional market, especially outside North America, since M3’s strength lies in its extensive feature set and broad integrations.
- Hotels that need operational analytics and financial management
- Teams that want customizable reports, forecasting, and integration
- Larger hotels or portfolios with complex data needs
Not ideal if your hotel prioritizes regional benchmarking only or has minimal data management requirements.
The Bottom Line for Hotels
Benchmarking Alliance provides specialized competitor benchmarks with regional insights, mainly suited for hotels in Europe aiming to refine revenue strategies. Its limited features make it less suitable for full operational management.
M3 offers a comprehensive suite of tools covering financials, forecasting, labor, and integrations, making it the clear choice for hotels in North America or those requiring extensive operational insights. Its higher review count and recent positive feedback give it a distinct advantage.
If your hotel prioritizes regional benchmarking accuracy, especially in Europe, Benchmarking Alliance may suffice. For broader operational needs, especially in North America, M3 offers a more complete platform.
For most hoteliers seeking a proven, feature-rich BI solution, M3’s extensive capabilities and recent high ratings make it the recommended choice. Benchmarking Alliance is ideal if your focus is solely on competitor benchmarking within its regional scope.
Quanto Costano Benchmarking Alliance e M3 (Insight)?
I prezzi di Business Intelligence raramente sono semplici. Ecco cosa sappiamo dai dati pubblici sui prezzi di ciascun fornitore. Richiedi sempre un preventivo personalizzato per la dimensione della tua struttura.
|
Benchmarking Alliance
|
M3
|
|
|---|---|---|
| Prezzo di Partenza | Da $100/mese | Da $300/mese |
Confronto delle funzionalità: Benchmarking Alliance vs M3 (Insight)
Queste sono le funzionalità configurate da ciascun fornitore, organizzate per gruppo di funzionalità — gli stessi dati mostrati nella dashboard del fornitore. Espandi un gruppo per confrontare le funzionalità affiancate.
| Funzionalità |
Benchmarking Alliance
|
M3
|
|---|---|---|
|
▾
Analitica
|
|
|
| Report e modelli personalizzati | ||
| Net Revenue KPIs | ||
| Altre previsioni di reddito, reportistica e analisi | ||
| Rapporti, analisi e previsioni su alimenti e bevande | ||
| Monitoraggio dell'account aziendale e dell'agenzia di viaggi | ||
| Dashboard di analisi | ||
| Monitoraggio della produttività del team di vendita | ||
| Stimolazione delle entrate | ||
| Dashboard e visualizzazione dei dati | ||
| Distribution Cost Analytics | ||
| Rapporti pianificati | ||
| Monitoraggio multi-proprietà e a livello di portafoglio | ||
| Monitoraggio dell'impatto delle decisioni sui prezzi | ||
| Contributo alla redditività del cliente | ||
| Calendario della domanda condivisa | ||
| Raggruppamento flessibile del portafoglio | ||
| Intelligenza artificiale | ||
|
▾
Previsione, budget e pianificazione
|
|
|
| Stimolazione delle entrate | ||
| Blocco delle previsioni e flussi di lavoro | ||
| Modelli basati sul driver | ||
| Rapporti, analisi e previsioni su alimenti e bevande | ||
| Altre previsioni di reddito, reportistica e analisi | ||
| Piani commerciali e di marketing | ||
| Controllo della versione | ||
| Basato sul Web | ||
| Monitoraggio dell'impatto delle decisioni sui prezzi | ||
| Calendario della domanda condivisa | ||
| Raggruppamento flessibile del portafoglio | ||
|
▾
Gestione dati
|
|
|
| Gestione multiproprietà | ||
| Gestione centralizzata di utenti e ruoli | ||
| Apri API | ||
| Raccolta e integrazione automatizzate dei dati | ||
| Gerarchie di dati personalizzabili | ||
| Gestione dei dati in-app | ||
| Raggruppamento flessibile del portafoglio | ||
|
▾
Collaborazione
|
|
|
| Collaborazione e commenti | ||
| Modelli e piani condivisibili | ||
| Allegati di file | ||
| Basato sul Web | ||
| Feed avvisi |
Risultati Reali: Benchmarking Alliance vs M3 per Obiettivo di Business
Abbiamo analizzato 3 casi studio verificati per confrontare cosa gli hotel ottengono realmente con ciascuna piattaforma su quattro obiettivi di business chiave.
Benchmarking Alliance
Nessun caso studio ancora pubblicato per questo obiettivo.
Yedla Management Company
Medio
"Using M3’s full best-of-suite solutions, we streamline all our information, which automatically feeds from our daily reports, making our financial processes much more efficient."
 Benchmarking Alliance
Nessun caso studio ancora pubblicato per questo obiettivo.
GF Hotels & Resorts
Grande
"Insight's ability to integrate with third-party data, such as Smith Travel and brand Guest Satisfaction Scores (GSS), is important because owners want to see more than just the rev..."

Benchmarking Alliance vs M3: Il Verdetto Finale
Funzionalità uniche
Cosa amano gli albergatori
Gli utenti sottolineano come la procedura di accesso semplice e sicura sia una caratteristica degna di nota, garantendo sicurezza e migliorando l'usab... Gli utenti sottolineano come la procedura di accesso semplice e sicura sia una caratteristica degna di nota, garantendo sicurezza e migliorando l'usabilità. Ciò facilita una navigazione più fluida sulla piattaforma, contribuendo positivamente all'efficienza operativa quotidiana.
La capacità di estrarre e localizzare rapidamente i report è spesso elogiata, in quanto migliora l'efficienza complessiva del recupero dei report. Gli... La capacità di estrarre e localizzare rapidamente i report è spesso elogiata, in quanto migliora l'efficienza complessiva del recupero dei report. Gli utenti trovano che questa funzionalità contribuisca a semplificare l'accesso ai dati, fondamentale per un processo decisionale informato e l'ottimizzazione operativa.
Funzionalità uniche
Dove le valutazioni divergono di più
Domande Frequenti su Benchmarking Alliance vs M3 (Insight)
Benchmarking Alliance può sostituire M3 (Insight)?
Dipende dalle tue esigenze. Benchmarking Alliance e M3 (Insight) condividono molte funzionalità di base di Business Intelligence, ma ciascuno ha capacità uniche. Benchmarking Alliance offre 18 partner di integrazione verificati, mentre M3 (Insight) ne offre 39. Consulta il confronto delle funzionalità sopra per vedere dove differiscono prima di cambiare.
Qual è migliore per hotel piccoli o indipendenti?
Gli hotel piccoli dovrebbero dare priorità alla facilità d'uso e a un onboarding rapido. M3 (Insight) è in testa per facilità d'uso con 4.5/5 vs 0.0/5. Cerca prezzi trasparenti e un'opzione di prova o demo. Filtra le recensioni su ogni pagina prodotto per dimensione della struttura per sentire le opinioni di hotel simili al tuo.
Benchmarking Alliance o M3 (Insight) offrono un piano gratuito?
Benchmarking Alliance: No. M3 (Insight): No. Nessuno dei due prodotti offre attualmente un livello gratuito. La maggior parte dei fornitori di Business Intelligence offre demo o prove gratuite — richiedine una a ciascuno per valutare prima di impegnarti.
Come Valuta e Classifica HTR Benchmarking Alliance e M3 (Insight)?
L'HT Score è una classifica composita che considera 4 gruppi di criteri e oltre una dozzina di variabili per aiutare gli albergatori a confrontare oggettivamente i prodotti tecnologici per hotel. Benchmarking Alliance ha un HT Score di 0 e M3 ha 95. Ecco come viene calcolato il punteggio.
| Gruppo di Criteri | Peso | Cosa Misura |
|---|---|---|
| Valutazioni e Recensioni dei Clienti |
|
Quanto raccomandano gli utenti questo prodotto? Punteggio Valutazioni, Volume Recensioni, Quota di Voce, Profondità Recensioni, Recenza Recensioni, Storie di Successo ▾ Il fattore con il peso maggiore. Analizza le valutazioni medie di soddisfazione (probabilità di raccomandazione, facilità d'uso, assistenza, ROI), il numero totale di recensioni rispetto ai concorrenti nella categoria, la recenza delle recensioni (almeno 20 recensioni negli ultimi 6 mesi) e la quota di voce tra clienti hotel unici per rilevare bias di selezione. |
| Ecosistema dei Partner |
|
Quanto raccomandano i partner tecnologici questa azienda? Raccomandazioni dei Partner, Quantità Integrazioni, Qualità Integrazioni ▾ Valuta le raccomandazioni dei partner come voti di fiducia degli esperti, il numero di integrazioni verificate e la qualità dell'ecosistema — la media degli HT Score dei partner di integrazione. I prodotti con ecosistemi di integrazione di qualità superiore hanno maggiori probabilità di offrire uno stack tecnologico connesso. |
| Centralità del Cliente |
|
Quanto è orientata al cliente questa organizzazione? Assistenza Certificata, Coerenza delle Recensioni, Completezza del Profilo ▾ Valuta se l'azienda ha ottenuto la Certificazione di Assistenza Clienti HTR, mantiene una raccolta di recensioni costante nel tempo (un indicatore di cultura orientata al feedback) e mantiene i profili prodotto completi con funzionalità, screenshot, prezzi e caratteristiche. |
| Portata, Solidità e Risorse |
|
Quanto sono estese la portata e le risorse di questa azienda? Portata Geografica, Solidità nel Tempo, Risorse Aziendali, Punteggio di Tendenza ▾ Misura la presenza globale (paesi e regioni servite), gli anni di attività come indicatore di stabilità, il numero di dipendenti come indicatore di risorse e un punteggio di tendenza basato su richieste degli acquirenti, recensioni, raccomandazioni dei partner e attività stampa degli ultimi dodici mesi. |
Le valutazioni e le recensioni dei clienti sono di gran lunga il fattore più importante nell'algoritmo dell'HT Score. HTR non accetta pagamenti per classifiche più alte. Tutte le recensioni sono verificate — solo i professionisti del settore alberghiero con affiliazioni confermate possono inviare valutazioni. Visualizza la metodologia completa dell'HT Score →
Quali Altri Confronti di Business Intelligence Stanno Leggendo gli Albergatori?
Esplora altri confronti diretti basati su recensioni verificate di albergatori.






Indice
Ottieni il tuo report gratuito di analisi AI
Consigli personalizzati su misura per la tua struttura


