

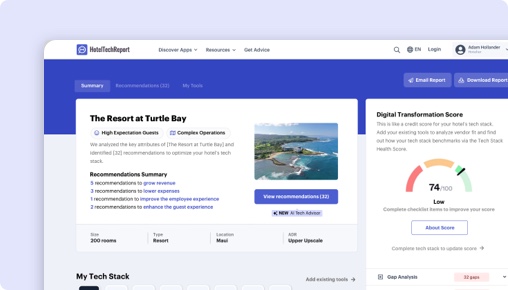
Désolé, cette fonctionnalité est réservée aux hôteliers vérifiés
Le tableau de bord des projets est un outil gratuit réservé aux hôteliers vérifiés. Il facilite l'adoption de nouvelles technologies en rationalisant leurs recherches et en simplifiant leurs échanges.

happyhotel vs. Radiant1:
Lequel vous convient le mieux ?


TLDR
Nous avons analysé 186 avis vérifiés d'hôteliers, comparé les fonctionnalités, les tarifs et des études de cas réelles pour identifier les points forts de chaque plateforme. Le bon choix dépend de votre type d'hôtel et de vos priorités :
happyhotel se distingue sur ease of use and customer support , avec des fonctionnalités exclusives comme Mobile Friendly Design.
Radiant1 se distingue , avec des fonctionnalités exclusives comme Market Insights Reporting.
Comment happyhotel se compare-t-il à Radiant1 ?
Notes comparées basées sur 186 avis vérifiés d'hôteliers sur HTR.
| HTScore |
|
|
| Probabilité de recommandation |
|
|
| Facilité d'utilisation |
|
|
| Support client |
|
|
| Rapport qualité-prix |
|
|
| Prix de départ | Dès 500 $/mois | Dès 400 $/mois |
| Avis vérifiés | 186 | 0 |
Quels sont les avantages et inconvénients de happyhotel vs Radiant1 ?
Après analyse de 186 avis vérifiés, les utilisateurs de happyhotel apprécient surtout support and onboarding service, dynamic pricing automation, rapports, tableaux de bord et analyses, tandis que ceux de Radiant1 mettent en avant . Cliquez sur un thème pour voir ce que disent les évaluateurs.
|
happyhotel
|
Radiant1
|
|---|---|
| Avantages | |
|
+
Support and onboarding service
▾
|
|
|
+
Dynamic pricing automation
▾
|
|
|
+
Rapports, tableaux de bord et analyses
▾
|
|
|
+
Ease of use and onboarding
▾
|
|
| Inconvénients | |
|
−
Transparence et contrôle des recommandations de prix
▾
|
|
happyhotel vs Radiant1 : Classement par segment hôtelier
Comment chaque produit se classe parmi les fournisseurs Systèmes de gestion des revenus pour différentes tailles d'établissement, types et régions — basé sur les avis vérifiés d'hôteliers dans chaque segment.
Par taille d'hôtel
| Segment |
happyhotel
|
Radiant1
|
|---|---|---|
| Petit (10-24 chambres) ▾ | #9 55 avis | — |
| Moyen (25-74 chambres) ▾ | #7 77 avis | — |
| Grand (75-199 chambres) ▾ | #31 1 avis | — |
| Très grand (200+ chambres) | #15 2 avis | — |
Par type d'hôtel
| Segment |
happyhotel
|
Radiant1
|
|---|---|---|
| Boutique ▾ | #13 36 avis | — |
| Luxe ▾ | #17 23 avis | — |
| Enseigne / Chaîne ▾ | #13 23 avis | — |
| Séjour prolongé ▾ | #9 18 avis | — |
Par région
| Segment |
happyhotel
|
Radiant1
|
|---|---|---|
| Europe ▾ | #9 139 avis | — |
| Asie-Pacifique | #23 1 avis | — |
The Decision
Choosing between happyhotel by happyhotel and Radiant1 by Radiant1 comes down to your hotel’s specific revenue management needs. Both products aim to optimize your pricing strategies, but happyhotel's extensive review base and recent positive feedback highlight its focus on automated, data-driven revenue management. Radiant1 offers a broader suite of tools, including channel management and booking engines, but lacks the depth of reviews and recent user insights that make happyhotel a more reliable choice right now.
If your goal is to improve revenue through automation, real-time data, and proven effectiveness, happyhotel is the clear frontrunner. However, if your hotel needs a broader platform including online visibility tools, Radiant1 might suit your requirements—though you'll have less review-based confidence in its capabilities.
Quick Verdict: Which RMS Is Better for Hotels?
happyhotel dominates with 151 reviews, a 5/5 overall rating, and recent feedback from over 60 users in the last six months, making it the more trusted option. Radiant1, with no reviews or recent feedback, offers an unclear picture of user satisfaction, despite its lower price point and broader toolset.
Given the data, happyhotel is the more reliable choice for hotels seeking proven revenue management efficiency. Radiant1 might appeal if you need a combination of PMS, channel management, and booking tools but will require your hotel to accept more unknowns about user satisfaction and performance.
Is happyhotel or Radiant1 Better for Hotels?
happyhotel specializes exclusively in revenue management, focusing on automating pricing decisions, forecasting, and analytics that directly impact your revenue. In contrast, Radiant1 offers an all-in-one platform with tools like channel management and booking engines, aiming to improve your property's online visibility and operational efficiency.
happyhotel's reviews highlight its user-friendly design, real-time automation, and impressive support, making it ideal for hotels that prioritize revenue optimization without the hassle of manual pricing. Radiant1's broader scope might better suit hotels seeking a comprehensive platform but lacks recent user validation and detailed feedback.
Are you looking for a tool primarily to boost revenue through automated pricing? Or do you want a wider platform that includes distribution and booking management? That decision will guide your choice.
happyhotel vs Radiant1: Which Should Your Hotel Choose?
If your hotel needs a dedicated revenue management system that automates pricing, improves profitability, and integrates well with PMS platforms, go with happyhotel. Its high review count and recent feedback confirm its effectiveness, ease of use, and strong support.
If your hotel requires a multipurpose system that combines PMS, channel management, and booking functionalities, Radiant1 might serve you better. However, given the lack of recent reviews and user feedback, your confidence in its performance and satisfaction is lower.
For small to medium hotels aiming to streamline revenue management, happyhotel’s proven track record makes it the safer bet. Larger hotels or properties seeking integrated distribution tools may lean toward Radiant1, but should do so with caution until more user feedback emerges.
Is happyhotel or Radiant1 Easier to Use?
happyhotel boasts a user-friendliness rating of 4.77/5, with most reviews praising its straightforward setup, clear analytics, and intuitive interface. Onboarding is rated 4.71/5, with many users mentioning how quickly they were able to start benefiting from its automation.
Radiant1 offers no recent reviews or user ratings, making it impossible to assess its ease of use. Its broad feature set could imply a steeper learning curve, especially for smaller teams or hotels without dedicated revenue managers.
Edge: happyhotel.
Which Has Better Features: happyhotel or Radiant1?
happyhotel provides 33 shared features plus 12 exclusive ones, such as multi-property management, price sensitivity modeling, five-year forecasting, and group pricing analysis. These features are designed specifically for revenue optimization, backed by recent user praise.
Radiant1 offers only 8 unique features, including manage sell-outs and future market demand data, but lacks the depth of automation and analytics found in happyhotel. Its broader suite emphasizes distribution and visibility rather than detailed revenue management.
Edge: happyhotel.
Which Has Better Customer Support: happyhotel or Radiant1?
happyhotel’s support scores a high 4.81/5, with reviewers consistently highlighting its personal, responsive service. Users describe the team as proactive and helpful, especially during onboarding and troubleshooting.
Radiant1’s support and user feedback are unavailable, making it difficult to assess service quality. Given the extensive review base for happyhotel, it’s clear that its support remains a key strength.
Edge: happyhotel.
Which Has More Integrations: happyhotel or Radiant1?
happyhotel integrates with 24 verified partners, including major PMS and distribution platforms like RoomRaccoon, apaleo, and SiteMinder, facilitating smooth data flow and operational harmony. Its integrations cover a broad spectrum of hotel management needs.
Radiant1 has just one verified partner, making its integration capabilities significantly more limited. This restricts its ability to connect with existing hotel systems and limits flexibility.
Edge: happyhotel.
Which Do Hoteliers Rate Higher: happyhotel or Radiant1?
happyhotel’s reviews are overwhelmingly positive, with a 5/5 rating from 151 users, including recent feedback from 63 hotels in the last six months. Hotels across various segments, especially city center and boutique hotels, praise its automation, support, and ease of use.
Radiant1 has no recent reviews or ratings, leaving hoteliers without user validation of its effectiveness. This lack of feedback diminishes confidence in its performance.
Edge: happyhotel.
How Much Do happyhotel and Radiant1 Cost?
happyhotel charges a flat monthly fee of $500, with no trial, freemium, or implementation fees. This predictable pricing makes budgeting straightforward.
Radiant1 costs $400 per month but offers no information about trial options or additional fees, making it less transparent.
What Type of Hotel Should Use happyhotel?
- Hotels that prioritize automated revenue management, dynamic pricing, and forecasting.
- Small to medium-sized properties seeking a user-friendly platform.
- Hotels needing seamless PMS integration and real-time data.
- Properties aiming to increase revenue through intelligent automation.
- Teams comfortable with cloud-based, SaaS solutions.
- Not ideal if your hotel requires extensive customization beyond revenue management.
- Not ideal if you need features like wide distribution, online booking, or channel management.
What Type of Hotel Should Use Radiant1?
- Hotels that want an integrated platform including PMS, channel management, and booking engines.
- Larger properties or chains seeking comprehensive operational tools.
- Hotels prioritizing online visibility and distribution alongside revenue management.
- Teams comfortable with less transparent, less reviewed solutions.
- Not ideal if your hotel relies heavily on proven, user-validated revenue management automation.
- Not ideal if you need detailed analytics or forecasting, which Radiant1 does not emphasize.
The Bottom Line for Hotels
happyhotel excels in automating revenue management, with proven results, high user satisfaction, and extensive integrations. Its focus on pricing automation and forecasting makes it ideal for hotels seeking to boost profitability efficiently.
Radiant1 offers a broader platform aimed at operational management and distribution but lacks recent validation from hotel users. This makes it a less reliable choice for revenue management alone but potentially useful if distribution and visibility are your primary concerns.
If your hotel’s main goal is revenue optimization through automation and analytics, happyhotel is the clear choice. For comprehensive distribution and management features, Radiant1 could be considered, but with caution and the expectation of limited user feedback to date.
Combien coûtent happyhotel et Radiant1 ?
La tarification des Systèmes de gestion des revenus est rarement simple. Voici ce que nous savons à partir des données tarifaires publiques de chaque fournisseur. Demandez toujours un devis personnalisé pour la taille de votre établissement.
|
happyhotel
|
Radiant1
|
|
|---|---|---|
| Prix de départ | Dès 500 $/mois | Dès 400 $/mois |
Comparaison des fonctionnalités : happyhotel vs Radiant1
Voici les fonctionnalités configurées par chaque fournisseur, organisées par groupe de fonctionnalités — les mêmes données que dans le tableau de bord du fournisseur. Développez un groupe pour comparer les fonctionnalités côte à côte.
| Fonctionnalité |
happyhotel
|
Radiant1
|
|---|---|---|
|
▾
Optimisation des prix
|
|
|
| Explication du prix | ||
| Directives commerciales d'entreprise | ||
| Autres recommandations de dates de séjour | ||
| Autres recommandations de propriétés | ||
| Optimisation des prix en temps réel | ||
| Contrôle dynamique de la hiérarchie des prix | ||
| Prix ouvert | ||
| Flux de travail guidés | ||
| Analyse de scénarios « et si » | ||
| Tarification dynamique | ||
| Set Boundaries | ||
| Manage Exceptions | ||
| Group Pricing | ||
| Manage Restrictions | ||
| Manage Sell-Outs & Cancellations | ||
| Business Mix Optimization | ||
| Define Cycles | ||
| Yield Room Types Individually | ||
| Bulk Adjustments | ||
| Tarification et prévisions sur 24 mois | ||
| Tarification des composants/salles virtuelles | ||
| Tarifs pour séjours prolongés | ||
| Tarification des ventes incitatives | ||
| Taux de réussite | ||
|
▾
Intelligence de marché et prévisions
|
|
|
| Prévisions quinquennales | ||
| Tarification à terme sur 365 jours | ||
| STR Data | ||
| 18-Month Forward Pricing | ||
| Modélisation de la sensibilité au prix | ||
| Multi-Property Dashboard | ||
| Market Intelligence Data | ||
| Interactive Customizable Dashboards | ||
| Données sur la demande future du marché | ||
| Générateur de prévisions financières | ||
| Prévision des séjours prolongés | ||
| Prévisions de canal | ||
| Explication des prévisions | ||
| Données flexibles sur les concurrents | ||
|
▾
Tableaux de bord et rapports
|
|
|
| Rapports personnalisés | ||
| Rapports programmés | ||
| Données d'entreprise perdues | ||
| Tableau de bord analytique | ||
| Interactive Customizable Dashboards | ||
| Market Insights Reporting | ||
| Pickup Analysis | ||
| Booking Pattern Analysis | ||
| Event Data | ||
| Price Change Logs | ||
| Customizable Notifications & Alerts | ||
| Displacement Analysis | ||
| Group Pricing & Evaluation | ||
| Multi-Property Dashboard | ||
| Mesure des avantages du système | ||
|
▾
Automatisation
|
|
|
| Controlled Automation/Algorithm Customization | ||
| Tarification automatisée par type de chambre | ||
| Gestion des revenus entièrement automatisée | ||
| Tarification dynamique | ||
| AI Optimization | ||
| Automatic Pricing Updates | ||
|
▾
Fonctionnalité multi-propriétés
|
|
|
| Gestion de l'inventaire | ||
| Gestion multi-propriétés | ||
| Multi-Property Dashboard | ||
|
▾
Entreprise de groupe
|
|
|
| Group Pricing & Evaluation | ||
| Analyse de scénarios « et si » | ||
| Displacement Analysis | ||
| Prévisions et lavages de groupe | ||
|
▾
Intégrations
|
|
|
| API ouverte | ||
| La gestion des canaux | ||
| Business Intelligence | ||
| STR Data | ||
| Property Management System | ||
| Authentification multifacteur | ||
|
▾
Other
|
|
|
| Tarification et évaluation de groupe | ||
| Application mobile | ||
| Technologie d'épandage intelligent | ||
| Authentification unique | ||
| Conception adaptée aux mobiles |
Résultats concrets : happyhotel vs Radiant1 par objectif commercial
Nous avons analysé 4 études de cas vérifiées pour comparer ce que les hôtels obtiennent réellement avec chaque plateforme sur quatre objectifs commerciaux clés.
Natur- & Wellnesshotels Brunner Hof 4****S (45 rooms, luxury resort, Germany)
Petit
"Before happyhotel, we handled prices manually and tracked everything in Excel. Now we have all key metrics in one place and save a lot of time every day."
 Radiant1
Aucune étude de cas publiée pour cet objectif pour le moment.
Hotel Öschberghof (127 rooms, luxury resort, Germany)
Petit
"Before we started using happyhotel, I manually entered prices into our PMS using self-made Excel sheets. We didn’t have a flexible pricing system and worked with seasonal tables, o..."
 Radiant1
Aucune étude de cas publiée pour cet objectif pour le moment.
happyhotel vs Radiant1 : Le verdict final
Ce que les hôteliers apprécient
Support is one of HappyHotel’s strongest themes: reviewers consistently describe the team as fast, competent, friendly and solution-oriented, especial... Support is one of HappyHotel’s strongest themes: reviewers consistently describe the team as fast, competent, friendly and solution-oriented, especially during onboarding and troubleshooting. The main criticism is not the quality of help, but responsiveness or access channels, with some asking for faster feedback, better phone availability or improved communication.
Users most often say HappyHotel automates rate changes based on demand, occupancy, booking pace and market conditions, reducing manual work and helpin... Users most often say HappyHotel automates rate changes based on demand, occupancy, booking pace and market conditions, reducing manual work and helping hotels capture more revenue. Many note that autopilot pricing is reliable and frees staff to focus elsewhere, while still allowing manual overrides when needed.
De nombreux utilisateurs soulignent la clarté des tableaux de bord, la visibilité des indicateurs clés de performance (KPI) et l'utilité des rapports,... De nombreux utilisateurs soulignent la clarté des tableaux de bord, la visibilité des indicateurs clés de performance (KPI) et l'utilité des rapports, qui facilitent la gestion des revenus. Parallèlement, ils demandent souvent des filtres plus flexibles, des indicateurs personnalisés, des comparaisons plus approfondies et des vues d'analyse plus abouties, notamment pour les établissements hôteliers complexes.
Les points de friction pour les hôteliers
Plusieurs utilisateurs souhaitent une meilleure visibilité sur le calcul des recommandations et un contrôle accru sur le comportement des algorithmes,... Plusieurs utilisateurs souhaitent une meilleure visibilité sur le calcul des recommandations et un contrôle accru sur le comportement des algorithmes, notamment pour les tarifs dérivés et les règles de tarification personnalisées. Bien que beaucoup fassent confiance au système après l'avoir utilisé, les utilisateurs réclament toujours des explications, un niveau d'agressivité ajustable, des algorithmes personnalisés et une meilleure gestion des majorations simples/doubles ou par catégorie.
Fonctionnalités uniques
Fonctionnalités uniques
Où les notes divergent le plus
Questions fréquentes sur happyhotel vs Radiant1
happyhotel peut-il remplacer Radiant1 ?
Cela dépend de vos besoins. happyhotel et Radiant1 partagent de nombreuses fonctionnalités Revenue Management Systems de base, mais chacun a des capacités uniques. happyhotel propose 24 partenaires d'intégration vérifiés, tandis que Radiant1 en propose 1. Consultez la comparaison des fonctionnalités ci-dessus pour voir les différences avant de changer.
Lequel est le mieux adapté aux petits hôtels ou hôtels indépendants ?
Les petits hôtels devraient privilégier la facilité d'utilisation et une prise en main rapide. happyhotel est en tête pour la facilité d'utilisation avec 4.8/5 contre 0.0/5. Recherchez une tarification transparente et une option d'essai ou de démonstration. Filtrez les avis sur chaque page produit par taille d'établissement pour lire les retours d'hôtels similaires au vôtre.
happyhotel ou Radiant1 proposent-ils une offre gratuite ?
happyhotel : Non. Radiant1 : Non. Aucun des deux produits ne propose actuellement d'offre gratuite. La plupart des fournisseurs Revenue Management Systems proposent des démonstrations ou des essais — demandez-en un à chacun pour évaluer avant de vous engager.
Comment HTR évalue-t-il et classe-t-il happyhotel et Radiant1 ?
Le HT Score est un classement composite qui prend en compte 4 groupes de critères et plus d'une douzaine de variables pour aider les hôteliers à comparer objectivement les produits technologiques hôteliers. happyhotel a un HT Score de 96 et Radiant1 a 0. Voici comment le score est calculé.
| Groupe de critères | Pondération | Ce qu'il mesure |
|---|---|---|
| Notes et avis clients |
|
À quel point les utilisateurs recommandent-ils ce produit ? Score des notes, Volume d'avis, Part de voix, Profondeur des avis, Récence des avis, Cas de réussite ▾ Le facteur le plus fortement pondéré. Analyse les notes de satisfaction moyennes (probabilité de recommandation, facilité d'utilisation, support, ROI), le nombre total d'avis par rapport aux pairs de la catégorie, la récence des avis (au moins 20 avis sur les 6 derniers mois) et la part de voix parmi les clients hôteliers uniques pour détecter les biais de sélection. |
| Écosystème partenaire |
|
À quel point les partenaires technologiques recommandent-ils cette entreprise ? Recommandations des partenaires, Nombre d'intégrations, Qualité des intégrations ▾ Évalue les recommandations des partenaires comme des votes de confiance d'experts, le nombre d'intégrations vérifiées et la qualité de l'écosystème — la moyenne des HT Scores des partenaires d'intégration. Les produits avec des écosystèmes d'intégration de meilleure qualité sont plus susceptibles de fournir un stack technologique connecté. |
| Orientation client |
|
À quel point cette organisation est-elle orientée client ? Support certifié, Régularité des avis, Complétude du profil ▾ Évalue si l'entreprise a obtenu la certification HTR de support client, maintient une collecte d'avis régulière dans le temps (un indicateur de culture axée sur le feedback) et tient à jour les profils produits avec les fonctionnalités, captures d'écran, tarifs et caractéristiques. |
| Portée, pérennité et ressources |
|
Quelle est l'étendue de la portée et des ressources de cette entreprise ? Portée géographique, Pérennité, Ressources de l'entreprise, Score de tendance ▾ Mesure la présence mondiale (pays et régions desservis), les années d'activité comme indicateur de stabilité, les effectifs comme indicateur de ressources, et un score de tendance basé sur les demandes d'acheteurs, les avis, les recommandations de partenaires et l'activité presse des douze derniers mois. |
Les notes et avis clients sont de loin le facteur le plus important dans l'algorithme du HT Score. HTR n'accepte aucun paiement pour un meilleur classement. Tous les avis sont vérifiés — seuls les professionnels du secteur hôtelier avec des affiliations confirmées peuvent soumettre des notes. Voir la méthodologie complète du HT Score →
Quelles autres comparaisons Systèmes de gestion des revenus les hôteliers consultent-ils ?
Explorez d'autres comparaisons directes basées sur les avis vérifiés d'hôteliers.



Sommaire
Obtenez votre rapport d'analyste IA gratuit
Recommandations personnalisées adaptées à votre établissement


Cherchons les informations sur votre hôtel
Vous hésitez encore sur vos options de systèmes de gestion des revenus ?
Voici quelques systèmes populaires de notre guide sur systèmes de gestion des revenus — ou laissez notre IA les noter un par un pour votre hôtel en deux minutes environ.


