


Subscribe to our weekly newsletter, Hotel Tech Insider
Join 100,000 executives from top brands like Accor, Marriott, Viceroy, Shangri-La, Rosewood, Expedia and AirBnB and get the latest innovations and insights delivered to your inbox once a week.
Popular in Operations
Best Property Management Systems of 2026
Your hotel's core operating system to effortlessly manage bookings, guest experiences, and operations.
Best Staff Collaboration Tools of 2026
Enhance team collaboration with real-time messaging, task sharing, and centralized updates across departments.
Best Hotel Accounting Software of 2026
Tools to manage your hotel's accounting, budgeting and financial planning.
Popular in Revenue Management
Best Revenue Management Systems of 2026
Maximize revenue with dynamic pricing, demand forecasting, and automated data insights.
Best Channel Managers of 2026
Hotel distribution software that syncs rates, availability and inventory across 3rd party channels
Best Business Intelligence of 2026
Say goodbye to spreadsheets and leverage modern BI tools to visualize your data and uncover hidden insights.
Popular in Marketing
Best Hotel CRM & Email Marketing of 2026
Turn guest data into action with personalized offers, targeted communication, and automated workflows.
Best Booking Engine of 2026
The eCommerce shopping cart for your hotel's website.
Best Hotel Metasearch Management Software of 2026
Setup, manage and optimize advertising campaigns across channels to drive direct bookings.
Popular in Guest Experience
Best Hotel Guest Apps of 2026
Enhance stays with a guest app offering amenities info, messaging, mobile ordering, and upsell opportunities.
Best Contactless Check-in of 2026
Empower guests with easy online check-in, digital authorizations, and seamless upsells.
Best Guest Messaging Software of 2026
Connect with guests instantly through real-time messaging, automated responses, and seamless communication.
The project dashboard is a free tool that is only available to verified hoteliers to make adopting new technology easier by streamlining their research and simplifying their communication workflow.

REVENUE MANAGEMENT
How Wythe Hotel uses Lighthouse’s Business Intelligence to streamline their workflows and gain a deeper understanding of the property’s performance.
“It gives us a well-rounded understanding of our key revenue drivers, the gaps and opportunities in our business strategy. This has helped us become more deliberate in our approach to pricing, sales and marketing.”
Understanding business performance: Before using Business Intelligence, we handled all data collection and collation manually. That included checking competitor rates one by one as well as going through cumbersome PMS reports to understand our performance. The most time-consuming task was gathering data from multiple sources to create the in-depth Excel reports we used to evaluate our business results. Especially as a small property without a dedicated revenue manager, this time-intensive approach caused challenges. It was always a balancing act to ensure all fronts were covered and no tasks were overlooked.
Saving time simplifying processes: Since we spend less time collecting and collating data, we now have more capacity to analyse and act on it. For example, Business Intelligence reveals the production of various segments, rates, room types or weekdays at the click of a button. As a result, we can quickly spot if an area is underperforming. Then, we immediately take the necessary actions to avoid losing out on business.
Deeper insights: When we meet with the owner and senior management to discuss our results and strategy, we want to present our data in a clear and concise format. In the past, the only way to do that was to manually compile Excel spreadsheets from bulky PMS reports. This took a lot of time and sometimes even the most in-depth spreadsheets couldn’t provide the level of insights we wanted.
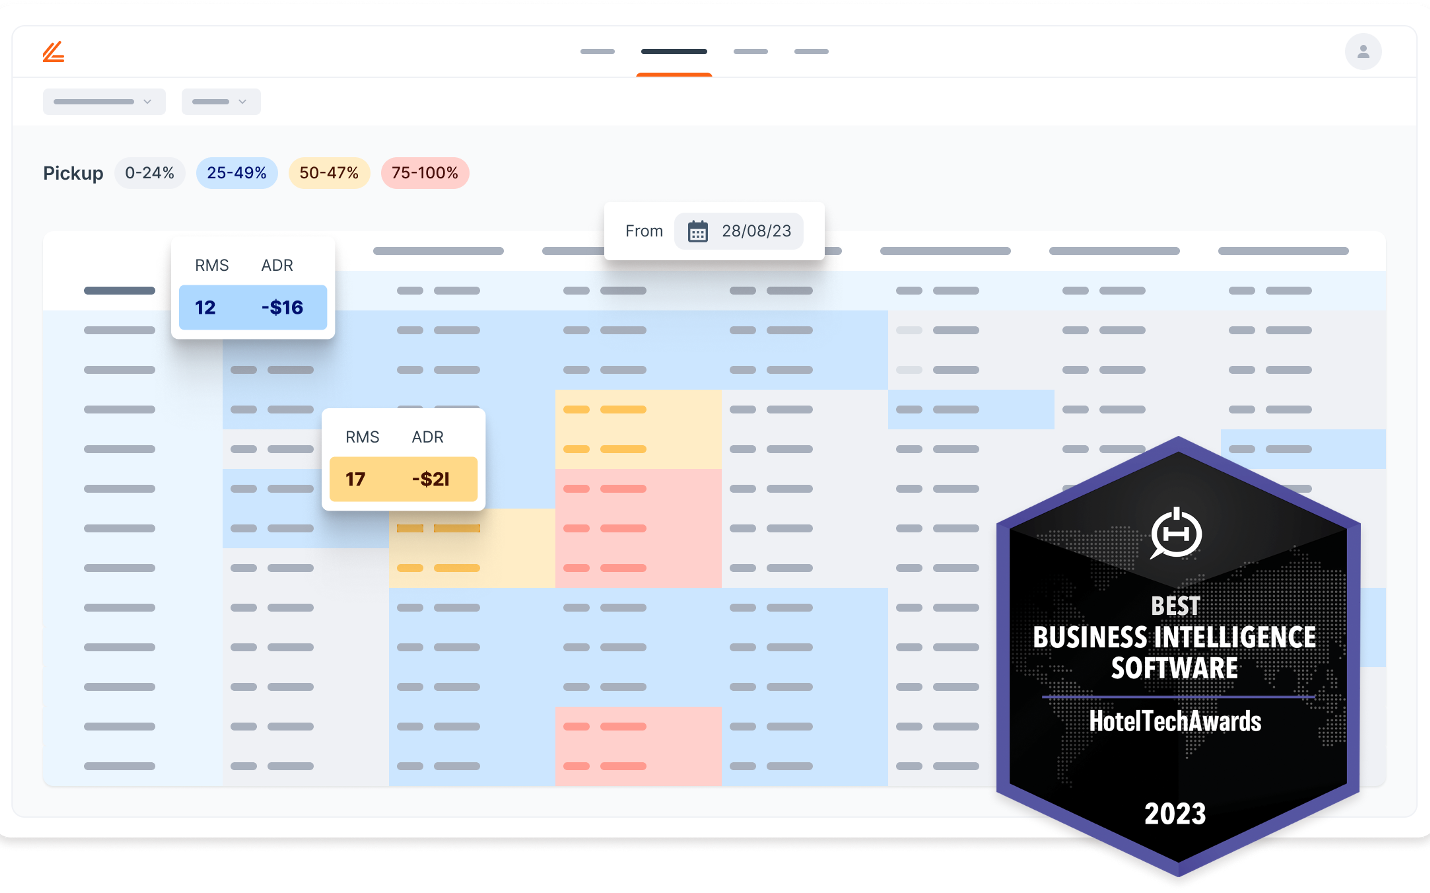
Lighthouse
Monitor, optimize, and report on your performance with the industry's leading business intelligence solution
Innovators Mentioned

Director of Revenue Management, Sales & Marketing
Wythe Hotel
"Implementing Revenue Insight has helped us drastically simplify our data collection and reporting process. We’ve cut the time we spend on this in half since the platform gives us real-time access to accurate performance data in just a few clicks."
Will Jordan
Director of Revenue Management, Sales & Marketing
"Implementing Revenue Insight has helped us drastically simplify our data collection and reporting process. We’ve cut the time we spend on this in half since the platform gives us real-time access to accurate performance data in just a few clicks."
Director of Revenue Management, Sales & Marketing Will Jordan said, about their decision: "Having tested other business intelligence tools, I think Revenue Insight is the most straightforward solution. It does the best job at making data accessible and presenting it in a clear format. I wouldn’t want to go back to working without it."
Implementing Lighthouse Business Intelligence has helped us drastically simplify our data collection and reporting process. We’ve cut the time we spend on this in half since the platform gives us real-time access to accurate performance data in just a few clicks.
Lighthouse Business Intelligence has also allowed us to learn more about our property and its performance overall. Since the tool puts so many detailed insights at our fingertips, we’ve started going deeper into the data. This gives us a well-rounded understanding of our key revenue drivers, the gaps and opportunities in our business strategy. This has helped us become more deliberate in our approach to pricing, sales and marketing.
With Lighthouse Business Intelligence, we can pull data for any time period, segment, rate or distribution channel whenever we want. It’s even possible to open the dashboard during a meeting and share live insights directly from the platform. This makes it much easier for us to share our results and provide background information on recent decisions and business trends. In short, our conversations around revenue strategy have become more productive and data-driven.
You may also enjoy
Subscribe to our weekly newsletter, Hotel Tech Insider
Join 100,000 executives from top brands like Accor, Marriott, Viceroy, Shangri-La, Rosewood, Expedia and AirBnB and get the latest innovations and insights delivered to your inbox once a week.

Custom recommendations tailored to your property


