

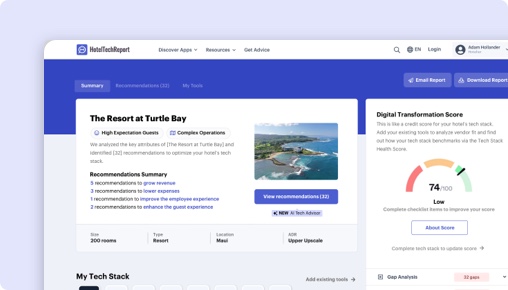
Sorry, this functionality is only available for verified hoteliers
The project dashboard is a free tool that is only available to verified hoteliers to make adopting new technology easier by streamlining their research and simplifying their communication workflow.

Amaze Insights vs. M3 (Insight):
Which Is Right for You?


TLDR
We analyzed 332 verified hotelier reviews, compared feature sets, pricing, and real-world case studies to break down where each platform delivers. The right choice depends on your property type and priorities:
M3 shines in business intelligence dashboards and decision support — especially for bed & breakfast properties (4.6/5), with exclusive features like Daily Reporting and Financial Reporting.
How Does Amaze Insights Compare to M3 (Insight)?
Side-by-side ratings based on 332 verified hotelier reviews on HTR.
| HTScore |
|
|
| Likelihood to Recommend |
|
|
| Ease of Use |
|
|
| Customer Support |
|
|
| Value for Money |
|
|
| Starting Price | Contact sales | From $300/mo |
| Verified Reviews | 0 | 332 |
What Are the Pros and Cons of Amaze Insights vs M3 (Insight)?
After analyzing 332 verified reviews, Amaze Insights users most value its , while M3 users highlight business intelligence dashboards and decision support, accounting automation and reduced manual coding, ease of use and navigation. Click any theme to see what reviewers say.
|
Amaze Insights
|
M3
|
|---|---|
| Pros | |
|
+
Business intelligence dashboards and decision support
▾
|
|
|
+
Accounting automation and reduced manual coding
▾
|
|
|
+
Ease of use and navigation
▾
|
|
|
+
Real-time invoice and data integration
▾
|
|
| Cons | |
|
−
Financial reporting and GL coding
▾
|
|
|
−
Support responsiveness and case follow-up
▾
|
|
|
−
Report customization and report writer limitations
▾
|
|
Amaze Insights vs M3: Rankings by Hotel Segment
How each product ranks among Business Intelligence vendors for different property sizes, types, and regions — based on verified reviews from hoteliers in each segment.
By Hotel Size
| Segment |
Amaze Insights
|
M3
|
|---|---|---|
| Small (10-24 rooms) ▾ | — | #7 13 reviews |
| Mid-Size (25-74 rooms) ▾ | — | #3 171 reviews |
| Large (75-199 rooms) ▾ | — | #4 46 reviews |
| X-Large (200+ rooms) ▾ | — | #5 19 reviews |
By Property Type
| Segment |
Amaze Insights
|
M3
|
|---|---|---|
| Boutique ▾ | — | #4 112 reviews |
| Luxury ▾ | — | #4 57 reviews |
| Branded / Chain ▾ | — | #3 191 reviews |
| Extended Stay ▾ | — | #3 30 reviews |
By Region
| Segment |
Amaze Insights
|
M3
|
|---|---|---|
| North America ▾ | — | #2 248 reviews |
| Europe | — | #24 2 reviews |
| Asia Pacific ▾ | — | #16 5 reviews |
Is Amaze Insights or M3 Better for Hotels?
Amaze Insights and M3 serve the business intelligence needs of hotels but differ sharply in maturity and scope. Amaze Insights is a nascent AI-driven analytics platform launched in 2022 with no verified user reviews or documented hotel segment data. M3, founded in 1998, offers a comprehensive suite of 47 unique features specifically designed for hotel accounting, budgeting, and forecasting, and has 306 verified reviews averaging 4.5/5 overall.
Both products address the critical challenge of transforming raw operational and financial data into actionable insights for hotel management. However, Amaze Insights currently provides no publicly available evidence of adoption or operational impact, while M3 integrates data from accounting, labor management, and revenue systems to enhance decision-making for portfolios of all sizes. This makes M3 the only evidence-backed choice for hotels seeking proven business intelligence solutions today.
Amaze Insights vs M3: Which Should Your Hotel Choose?
If you manage a hotel portfolio requiring robust, real-time financial reporting, budgeting, and forecasting with proven user satisfaction, M3 is the clear choice. Its 306 reviews, including 36 in the last six months, show consistent 4.5-star ratings across hotel segments like branded hotels (4.5/5, 216 reviews) and boutique hotels (4.5/5, 121 reviews). M3 serves diverse hotel types including luxury, extended stay, and limited service, supporting multiple properties with centralized management and integration with 42 verified partners.
Amaze Insights lacks review data, case studies, or segment-specific ratings, leaving its fit unproven. If your hotel seeks a cutting-edge AI analytics platform and you are willing to adopt an untested product, Amaze Insights might be of interest, but no user evidence currently supports operational benefits or ease of adoption for hoteliers.
Is Amaze Insights or M3 Easier to Use?
Ease of use and onboarding ratings are only available for M3, which scores 4.5/5 for ease of use and 4.3/5 for onboarding across 306 reviews. Users praise M3’s user-friendly interface for accounting teams and front-office staff, citing straightforward access to reports and budgeting tools. Some mention navigation challenges in deeper analytics but overall find it manageable.
Amaze Insights has no available ratings or user feedback on ease of use or onboarding, making direct comparison impossible. Given M3’s extensive review base and consistent high scores, it has a clear advantage in documented usability.
Edge: Even.
Which Has Better Features: Amaze Insights or M3?
M3 offers 47 unique hospitality-specific business intelligence features, including daily reporting, general ledger management, accounts payable, cash management, budgeting, forecasting, document imaging, and multi-property management. These features support workflows from front desk to finance, enabling hotels to automate invoice coding, streamline month-end close, and generate customized financial and operational reports. M3’s open API and integration with labor standards and sales productivity tracking enhance portfolio-level decision-making.
Amaze Insights does not list any standalone features in the source material. Its AI-driven data summarization and recommendation engine could theoretically provide strategic insights but lacks documented operational features or workflows that hotels currently use.
Edge: M3.
Which Has Better Customer Support: Amaze Insights or M3?
Customer support ratings are available only for M3, with a 4.5/5 score over 306 reviews and an onboarding rating of 4.3/5. Reviewers commonly praise M3’s prompt and kind service, facilitating accounting team workflows. One reviewer noted diminishing follow-up responsiveness, indicating occasional inconsistency.
Amaze Insights has no customer support ratings or reviews to evaluate. Without user feedback, no comparison can be made, but M3’s established support track record provides more reliable evidence.
Edge: Even.
Which Has More Integrations: Amaze Insights or M3?
M3 has 42 verified integrations including key hotel systems such as HOTELTIME, STR, WebRezPro, innRoad, and yieldPlanet. These connections enable automated data gathering and real-time financial visibility, critical for hotels with complex operations or multiple properties.
Amaze Insights connects to only 3 partners: SalesAndCatering.com, Event Temple, and Tripleseat, which focus on event management rather than comprehensive hotel accounting or labor data. Amaze Insights lacks integrations with major financial or operational systems, limiting its utility for extensive portfolio reporting.
Edge: M3.
Which Do Hoteliers Rate Higher: Amaze Insights or M3?
Only M3 has verified hotelier ratings, averaging 4.5/5 from 306 reviews, with 36 recent reviews maintaining the same average. Its segment-specific ratings show strong satisfaction among branded hotels (4.5/5, 216 reviews), boutique hotels (4.5/5, 121 reviews), and bed & breakfasts (4.6/5, 137 reviews), indicating broad appeal across hotel types.
Amaze Insights has no reviews to provide a rating or segment analysis. This lack of rating data prevents any assessment of hotelier satisfaction or product fit.
Edge: Even.
How Much Do Amaze Insights and M3 Cost?
Amaze Insights does not publish pricing information, offers no freemium or trial options, and has no disclosed implementation fees.
M3’s base price starts at $300 monthly, without per-room charges or implementation fees, providing a transparent cost baseline for budgeting. M3 does not offer a trial version.
Hotels evaluating these products must contact Amaze Insights directly for pricing details, while M3’s established pricing model supports easier cost comparison.
What Type of Hotel Should Use Amaze Insights?
- Hotels and teams seeking an AI-powered analytics platform to transform complex data into actionable business recommendations.
- Companies interested in event-driven analytics through integration with SalesAndCatering.com, Event Temple, or Tripleseat.
- Operators willing to invest in an unproven, early-stage solution without user reviews or case studies.
- Properties that prioritize strategic insights over operational reporting or accounting integration.
Not ideal if:
- Your hotel requires proven financial reporting, budgeting, and forecasting tools with extensive integration.
- You need a platform with a large user base, documented ease of use, and robust customer support.
- You manage multiple properties or require portfolio-level data consolidation.
What Type of Hotel Should Use M3?
- Hotels of all sizes seeking a comprehensive business intelligence and accounting platform with 47 hospitality-specific features.
- Multi-property groups requiring centralized user and role management, multi-property reporting, and portfolio analytics.
- Accounting teams benefiting from real-time invoice integration, document imaging, and automated GL coding.
- Hotel GMs and finance leaders who need accessible dashboards for budgeting, forecasting, and profitability analysis.
- Properties that integrate with industry data sources like STR and rely on secure, web-based access.
Not ideal if:
- You want an AI-driven recommendation engine beyond traditional BI and accounting functions.
- Your operation demands a mobile app interface, as users desire a dedicated app for easier access.
- You need highly customizable report design with seamless linked updates, which some reviewers find limited.
Amaze Insights vs M3: The Bottom Line for Hotels
The core difference between Amaze Insights and M3 is maturity and operational depth. Amaze Insights offers a modern AI-driven analytics concept but lacks any verified hotel users, feature disclosures, or case studies. M3 provides a proven, feature-rich business intelligence and accounting platform with hundreds of positive reviews from diverse hotel segments.
Choose Amaze Insights only if your hotel seeks an early-stage AI analytics experiment and is prepared for limited vendor transparency and unproven results. Choose M3 for reliable, hotel-specific financial reporting, budgeting, and forecasting, supported by 306 reviews averaging 4.5 stars and integrations with 42 key hospitality systems. M3’s extensive feature set and real-time data capabilities make it the superior choice for hotels aiming to improve operational financial management today.
How Much Do Amaze Insights and M3 (Insight) Cost?
Business Intelligence pricing is rarely straightforward. Here is what we know from each vendor's public pricing data. Always request a custom quote for your property size.
|
Amaze Insights
|
M3
|
|
|---|---|---|
| Starting Price | — | From $300/mo |
Feature Comparison: Amaze Insights vs M3 (Insight)
These are the features each vendor has configured, organized by feature group — the same data shown in the vendor dashboard. Expand a group to compare features side by side.
| Feature |
Amaze Insights
|
M3
|
|---|---|---|
|
▾
Analytics
|
|
|
| Custom Reports & Templates | ||
| Net Revenue KPIs | ||
| Other Income Forecasting, Reporting & Analysis | ||
| Food & Beverage Reporting, Analysis & Forecasting | ||
| Corporate & Travel Agency Account Tracking | ||
| Analytics dashboard | ||
| Sales team productivity tracking | ||
| Revenue pacing | ||
| Dashboarding & data visualization | ||
| Distribution Cost Analytics | ||
| Scheduled Reports | ||
| Multi-Property & Portfolio Level Tracking | ||
| Pricing Decision Impact Tracking | ||
| Profitability Contribution by Customer | ||
| Shared Demand Calendar | ||
| Flexible Portfolio Grouping | ||
| Artificial Intelligence | ||
|
▾
Forecasting, Budgeting & Planning
|
|
|
| Revenue pacing | ||
| Forecast Locking & Workflows | ||
| Driver Based Models | ||
| Food & Beverage Reporting, Analysis & Forecasting | ||
| Other Income Forecasting, Reporting & Analysis | ||
| Business & marketing plans | ||
| Version Control | ||
| Web Based | ||
| Pricing Decision Impact Tracking | ||
| Shared Demand Calendar | ||
| Flexible Portfolio Grouping | ||
|
▾
Data Management
|
|
|
| Multi-property management | ||
| Centralized user & role management | ||
| Open API | ||
| Automated data gathering & integration | ||
| Customizable Data Hierarchies | ||
| In-App Data Management | ||
| Flexible Portfolio Grouping | ||
|
▾
Collaboration
|
|
|
| Collaboration & Commenting | ||
| Shareable Templates & Plans | ||
| File Attachments | ||
| Web Based | ||
| Alerts Feed |
Real-World Results: Amaze Insights vs M3 by Business Goal
We analyzed 5 verified case studies to compare what hotels actually achieve with each platform across four key business objectives.
Amaze Insights
No published case study for this goal yet.
Yedla Management Company
Mid-Size
"Using M3’s full best-of-suite solutions, we streamline all our information, which automatically feeds from our daily reports, making our financial processes much more efficient."
 Amaze Insights
No published case study for this goal yet.
GF Hotels & Resorts
Large
"Insight's ability to integrate with third-party data, such as Smith Travel and brand Guest Satisfaction Scores (GSS), is important because owners want to see more than just the rev..."

Amaze Insights vs M3: The Bottom Line
What hoteliers love
Insight dashboards are described as useful for turning financial data into information that management can use to control costs and improve profitabil... Insight dashboards are described as useful for turning financial data into information that management can use to control costs and improve profitability. Reviewers see value in BI visibility for smarter decisions, but they want more intuitive dashboards and easier ways to drill into the data.
Reviewers highlight that M3 reduces the manual work of coding, mailing, and requesting invoice details, which saves significant time for general manag... Reviewers highlight that M3 reduces the manual work of coding, mailing, and requesting invoice details, which saves significant time for general managers and accounting staff. The tool appears to streamline back-office processing and lower labor cost by automating repetitive finance tasks.
Some users find the platform easy to use and navigate, especially for daily tasks, while others specifically criticize the Insight experience as not i... Some users find the platform easy to use and navigate, especially for daily tasks, while others specifically criticize the Insight experience as not intuitive enough. The feedback suggests usability is generally a strength, but deeper analytics workflows still need simplification.
Where hoteliers push back
Several reviewers mention GL coding and reporting as a key use case, with M3 pushing coded data and reports directly to the dashboard for accounting r... Several reviewers mention GL coding and reporting as a key use case, with M3 pushing coded data and reports directly to the dashboard for accounting review. Users value having the financial structure and report outputs they need in one place, though report-building flexibility is sometimes an issue.
One reviewer strongly criticizes support follow-up, saying they no longer receive timely callbacks or updates when opening a case. This indicates that... One reviewer strongly criticizes support follow-up, saying they no longer receive timely callbacks or updates when opening a case. This indicates that service responsiveness can negatively affect the overall experience even when the software itself is useful.
Unique capabilities
Frequently Asked Questions About Amaze Insights vs M3 (Insight)
Can Amaze Insights replace M3 (Insight)?
It depends on your requirements. Amaze Insights and M3 (Insight) share many core Business Intelligence features, but each has unique capabilities. Amaze Insights offers 3 verified integration partners, while M3 (Insight) offers 42. Review the feature comparison above to see where they differ before switching.
Do Amaze Insights or M3 (Insight) offer a free plan?
Amaze Insights: No. M3 (Insight): No. Neither product currently offers a free tier. Most Business Intelligence vendors offer demos or trials — request one from each to evaluate before committing.
How Does HTR Evaluate and Rank Amaze Insights and M3 (Insight)?
The HT Score is a composite ranking that considers 4 criteria groups and over a dozen variables to help hoteliers objectively compare hotel technology products. Amaze Insights has an HT Score of 0 and M3 has 95. Here is how the score is calculated.
| Criteria Group | Weight | What It Measures |
|---|---|---|
| Customer Ratings & Reviews |
|
How highly do users recommend this product? Ratings Score, Review Volume, Share of Voice, Review Depth, Review Recency, Success Stories ▾ The most heavily weighted factor. Analyzes average satisfaction ratings (likelihood to recommend, ease of use, support, ROI), total review count relative to category peers, review recency (at least 20 reviews in the trailing 6 months), and share of voice across unique hotel clients to detect selection bias. |
| Partner Ecosystem |
|
How highly do tech partners recommend this company? Partner Recommendations, Integration Quantity, Integration Quality ▾ Evaluates partner recommendations as expert votes of confidence, the number of verified integrations, and ecosystem quality — the average HT Scores of integration partners. Products with higher-quality integration ecosystems are more likely to deliver a connected tech stack. |
| Customer Centricity |
|
How customer-centric is this organization? Certified Support, Review Consistency, Profile Completeness ▾ Assesses whether the company has earned HTR Customer Support Certification, maintains consistent review collection over time (an indicator of feedback-driven culture), and keeps product profiles complete with capabilities, screenshots, pricing, and features. |
| Reach, Staying Power & Resources |
|
How extensive is this company's reach and resourcing? Geographic Reach, Staying Power, Company Resources, Trending Score ▾ Measures global presence (countries and regions served), years in business as a stability proxy, team headcount as a resource proxy, and a trending score based on trailing-twelve-month buyer inquiries, reviews, partner recommendations, and press activity. |
Customer ratings and reviews are by far the most important factor in the HT Score algorithm. HTR does not accept payment for higher rankings. All reviews are verified — only hotel industry practitioners with confirmed affiliations can submit ratings. View full HT Score methodology →
What Other Business Intelligence Comparisons Are Hoteliers Reading?
Explore more head-to-head comparisons based on verified hotelier reviews.





Contents
Get Your Free AI Analyst Report
Custom recommendations tailored to your property


