

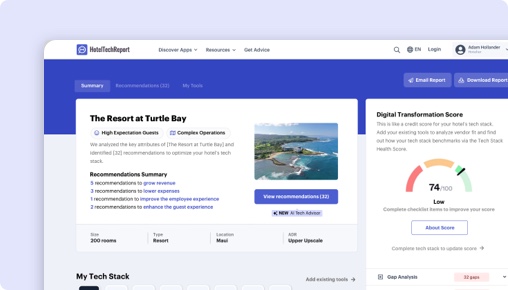
Sorry, this functionality is only available for verified hoteliers
The project dashboard is a free tool that is only available to verified hoteliers to make adopting new technology easier by streamlining their research and simplifying their communication workflow.

Benchmarking Alliance vs. M3 (Insight):
Which Is Right for You?


TLDR
We analyzed 274 verified hotelier reviews, compared feature sets, pricing, and real-world case studies to break down where each platform delivers. The right choice depends on your property type and priorities:
Benchmarking Alliance shines , with exclusive features like Shared Demand Calendar.
M3 shines in ease of use and customer support — especially for brand properties (4.1/5) , with exclusive features like Daily Reporting and Financial Reporting.
How Does Benchmarking Alliance Compare to M3 (Insight)?
Side-by-side ratings based on 274 verified hotelier reviews on HTR.
| HTScore |
|
|
| Likelihood to Recommend |
|
|
| Ease of Use |
|
|
| Customer Support |
|
|
| Value for Money |
|
|
| Starting Price | From $100/mo | From $300/mo |
| Verified Reviews | 0 | 274 |
What Are the Pros and Cons of Benchmarking Alliance vs M3 (Insight)?
After analyzing 274 verified reviews, Benchmarking Alliance users most value its , while M3 users highlight secure and simple login process, efficient report retrieval. Click any theme to see what reviewers say.
|
Benchmarking Alliance
|
M3
|
|---|---|
| Pros | |
|
+
Secure and Simple Login Process
▾
|
|
|
+
Efficient Report Retrieval
▾
|
|
| Cons | |
Benchmarking Alliance vs M3: Rankings by Hotel Segment
How each product ranks among Business Intelligence vendors for different property sizes, types, and regions — based on verified reviews from hoteliers in each segment.
By Hotel Size
| Segment |
Benchmarking Alliance
|
M3
|
|---|---|---|
| Small (10-24 rooms) ▾ | — | #6 13 reviews |
| Mid-Size (25-74 rooms) ▾ | — | #3 171 reviews |
| Large (75-199 rooms) ▾ | — | #4 39 reviews |
| X-Large (200+ rooms) ▾ | — | #5 19 reviews |
By Property Type
| Segment |
Benchmarking Alliance
|
M3
|
|---|---|---|
| Boutique ▾ | — | #3 107 reviews |
| Luxury ▾ | — | #5 53 reviews |
| Branded / Chain ▾ | — | #3 180 reviews |
| Extended Stay ▾ | — | #3 30 reviews |
By Region
| Segment |
Benchmarking Alliance
|
M3
|
|---|---|---|
| North America ▾ | — | #2 241 reviews |
| Europe | — | #25 2 reviews |
| Asia Pacific ▾ | — | #17 5 reviews |
| Middle East | — | #15 0 reviews |
The Decision
Choosing the right business intelligence platform for your hotel hinges on understanding each product’s core strengths and how they align with your operational needs. Benchmarking Alliance by Benchmarking Alliance focuses on providing detailed competitor benchmarks to boost revenue, primarily in the Nordic and Baltic regions. Conversely, M3 (Insight) from M3 offers a broad suite of analytics, financial management, and operational tools with extensive integration options, mainly serving the North American market.
Both products aim to help you make data-driven decisions, but they do so through different lenses. Benchmarking Alliance emphasizes comparative performance metrics, while M3 provides a comprehensive analytics ecosystem. Are you prioritizing regional benchmarking accuracy or integrated operational insights?
Is Benchmarking Alliance or M3 Better for Hotels?
Benchmarking Alliance specializes in delivering precise, competitive benchmarks based on data from over 2,500 hotels, predominantly in Europe. Your team will find it invaluable if your focus is on understanding how your property stacks against regional competitors to identify revenue opportunities. However, its limited feature set—only 16 shared features—means it lacks operational tools like budgeting or forecasting, which are more robust in M3.
M3, with a review count of 237 and recent reviews in the last six months, boasts a 4.16/5 overall rating and a 92.5/100 HTR score, indicating a more reliable and current user experience. Its extensive feature set and higher customer satisfaction make it the stronger choice if you need a full operational BI platform. Do you need in-depth benchmarking or a broader operational toolkit?
M3 vs Benchmarking Alliance: Which Should Your Hotel Choose?
If your hotel needs precise regional performance benchmarks to inform revenue management strategies, Benchmarking Alliance is a compelling choice due to its specialized focus and regional coverage. Its core offering of competitor KPIs helps you identify market gaps and optimize pricing strategies effectively.
On the other hand, if you require a robust, all-in-one BI solution that covers financial reporting, forecasting, labor management, and integration with industry data sources, M3 is the better fit. Its 31 unique features, including daily reporting, general ledger, and forecasting, serve hotels looking for comprehensive operational insights.
Hotels in Europe aiming for regional benchmarking should lean toward Benchmarking Alliance. Hotels seeking a broader, integrated solution suited for North American markets and larger portfolios should prioritize M3.
Is Benchmarking Alliance or M3 Easier to Use?
Benchmarking Alliance does not provide extensive user experience data but, given its narrow focus, is likely straightforward for users primarily interested in benchmarking metrics. M3, rated 4.46/5 for ease of use based on 237 reviews, impresses with its intuitive dashboard, secure login, and quick report retrieval. Users praise its straightforward navigation and efficient onboarding, with a review stating, "Support at M3 is always quick and personal with follow-up throughout the process."
Edge: M3.
Which Has Better Features: Benchmarking Alliance or M3?
Benchmarking Alliance offers only 16 shared features, including competitor KPIs and demand calendars, making it suitable for benchmarking but limited in operational functions. M3, with 31 features, surpasses this by including daily reporting, general ledger, budgeting, forecasting, labor standards, report writer, and API access.
The additional capabilities in M3 enable comprehensive management of hotel finances, labor, and performance data, whereas Benchmarking Alliance stays focused on performance comparison. If your hotel needs a full operational BI suite, M3’s feature set clearly delivers more value.
Edge: M3.
Which Has Better Customer Support: Benchmarking Alliance or M3?
While Benchmarking Alliance’s support ratings are unavailable, M3's user feedback highlights its support team as prompt and personable, with an average rating of 4.48/5. Reviewers appreciate quick responses and ongoing follow-up, describing support as "support at M3 is always quick and personal." This consistency enhances onboarding and daily use.
Given the lack of support data for Benchmarking Alliance, the clear choice is M3, backed by positive recent reviews. Support quality significantly impacts operational continuity and ease of use.
Edge: M3.
Which Has More Integrations: Benchmarking Alliance or M3?
Benchmarking Alliance integrates with 19 verified partners, including Juyo Analytics and VISIT, focusing on niche industry integrations. M3 offers 39 verified partners, including major property management systems like Mews, STR, InnRoad, and Birchstreet, providing a broader set of integration options for operational data.
The extensive integration network in M3 allows your hotel to connect with essential industry tools, feeding comprehensive data into its analytics environment. If seamless system interoperability is critical, M3’s integrations outperform those of Benchmarking Alliance.
Edge: M3.
Which Do Hoteliers Rate Higher: Benchmarking Alliance or M3?
Since Benchmarking Alliance has no reviews listed, we rely on M3’s data—237 reviews with a 4.16/5 overall rating. Hotels across various segments praise M3 for its ease of use, support, and feature richness, especially in North American markets.
In recent reviews, properties value M3’s ability to consolidate data and provide actionable insights, with quotes like, "Insight's ability to integrate with third-party data is important because owners want to see more than just revenue from the day." M3’s high review count and recent feedback make it the more trusted choice among hoteliers.
Edge: M3.
How Much Do Benchmarking Alliance and M3 Cost?
Benchmarking Alliance’s pricing begins at $100 per month, with no free trial or tiered options mentioned. M3’s base price is $300 per month, also without a trial, reflecting its broader feature set and integrations.
While Benchmarking Alliance offers a lower entry point, its limited features might justify the higher investment in M3 if your hotel needs operational insights as well as benchmarking. Cost should be weighed against the value of the deeper capabilities.
What Type of Hotel Should Use Benchmarking Alliance?
Hotels that primarily focus on regional revenue benchmarking to refine pricing and market positioning will benefit from Benchmarking Alliance’s detailed competitor data. Teams that want clear, region-specific insights into market performance without needing extensive operational tools are ideal users.
Not ideal if your hotel requires comprehensive financial management, forecasting, or labor tools, as Benchmarking Alliance’s limited feature set doesn’t support these needs. It’s better suited for hotels aiming to refine revenue strategies through competitive benchmarking alone.
- Hotels that want to compare KPIs against regional competitors
- Teams focused on revenue maximization through benchmarking
- Hotels with a regional, Nordic, or Baltic presence
Not ideal if your hotel needs integrated financial, forecasting, or operational tools. Larger portfolios or North American-focused properties should consider M3 instead.
What Type of Hotel Should Use M3?
Hotels seeking a full-featured business intelligence platform to manage finances, labor, and operational data should choose M3. It is also well-suited for hotels with complex reporting needs, such as daily operational dashboards, forecasting, and integration with third-party data sources.
Not ideal if your hotel only requires benchmarking data or operates in a limited regional market, especially outside North America, since M3’s strength lies in its extensive feature set and broad integrations.
- Hotels that need operational analytics and financial management
- Teams that want customizable reports, forecasting, and integration
- Larger hotels or portfolios with complex data needs
Not ideal if your hotel prioritizes regional benchmarking only or has minimal data management requirements.
The Bottom Line for Hotels
Benchmarking Alliance provides specialized competitor benchmarks with regional insights, mainly suited for hotels in Europe aiming to refine revenue strategies. Its limited features make it less suitable for full operational management.
M3 offers a comprehensive suite of tools covering financials, forecasting, labor, and integrations, making it the clear choice for hotels in North America or those requiring extensive operational insights. Its higher review count and recent positive feedback give it a distinct advantage.
If your hotel prioritizes regional benchmarking accuracy, especially in Europe, Benchmarking Alliance may suffice. For broader operational needs, especially in North America, M3 offers a more complete platform.
For most hoteliers seeking a proven, feature-rich BI solution, M3’s extensive capabilities and recent high ratings make it the recommended choice. Benchmarking Alliance is ideal if your focus is solely on competitor benchmarking within its regional scope.
How Much Do Benchmarking Alliance and M3 (Insight) Cost?
Business Intelligence pricing is rarely straightforward. Here is what we know from each vendor's public pricing data. Always request a custom quote for your property size.
|
Benchmarking Alliance
|
M3
|
|
|---|---|---|
| Starting Price | From $100/mo | From $300/mo |
Feature Comparison: Benchmarking Alliance vs M3 (Insight)
These are the features each vendor has configured, organized by feature group — the same data shown in the vendor dashboard. Expand a group to compare features side by side.
| Feature |
Benchmarking Alliance
|
M3
|
|---|---|---|
|
▾
Analytics
|
|
|
| Custom Reports & Templates | ||
| Net Revenue KPIs | ||
| Other Income Forecasting, Reporting & Analysis | ||
| Food & Beverage Reporting, Analysis & Forecasting | ||
| Corporate & Travel Agency Account Tracking | ||
| Analytics dashboard | ||
| Sales team productivity tracking | ||
| Revenue pacing | ||
| Dashboarding & data visualization | ||
| Distribution Cost Analytics | ||
| Scheduled Reports | ||
| Multi-Property & Portfolio Level Tracking | ||
| Pricing Decision Impact Tracking | ||
| Profitability Contribution by Customer | ||
| Shared Demand Calendar | ||
| Flexible Portfolio Grouping | ||
| Artificial Intelligence | ||
|
▾
Forecasting, Budgeting & Planning
|
|
|
| Revenue pacing | ||
| Forecast Locking & Workflows | ||
| Driver Based Models | ||
| Food & Beverage Reporting, Analysis & Forecasting | ||
| Other Income Forecasting, Reporting & Analysis | ||
| Business & marketing plans | ||
| Version Control | ||
| Web Based | ||
| Pricing Decision Impact Tracking | ||
| Shared Demand Calendar | ||
| Flexible Portfolio Grouping | ||
|
▾
Data Management
|
|
|
| Multi-property management | ||
| Centralized user & role management | ||
| Open API | ||
| Automated data gathering & integration | ||
| Customizable Data Hierarchies | ||
| In-App Data Management | ||
| Flexible Portfolio Grouping | ||
|
▾
Collaboration
|
|
|
| Collaboration & Commenting | ||
| Shareable Templates & Plans | ||
| File Attachments | ||
| Web Based | ||
| Alerts Feed |
Real-World Results: Benchmarking Alliance vs M3 by Business Goal
We analyzed 3 verified case studies to compare what hotels actually achieve with each platform across four key business objectives.
Benchmarking Alliance
No published case study for this goal yet.
Yedla Management Company
Mid-Size
"Using M3’s full best-of-suite solutions, we streamline all our information, which automatically feeds from our daily reports, making our financial processes much more efficient."
 Benchmarking Alliance
No published case study for this goal yet.
GF Hotels & Resorts
Large
"Insight's ability to integrate with third-party data, such as Smith Travel and brand Guest Satisfaction Scores (GSS), is important because owners want to see more than just the rev..."

Benchmarking Alliance vs M3: The Bottom Line
Unique capabilities
What hoteliers love
Users highlight the secure and easy login process as a notable feature, ensuring safety and improving usability. This facilitates smoother navigation... Users highlight the secure and easy login process as a notable feature, ensuring safety and improving usability. This facilitates smoother navigation across the platform, contributing positively to daily operational efficiency.
The ability to pull and locate reports quickly is frequently praised, as it enhances overall report retrieval efficiency. Users find this feature help... The ability to pull and locate reports quickly is frequently praised, as it enhances overall report retrieval efficiency. Users find this feature helps streamline data access, crucial for informed decision-making and operational optimization.
Unique capabilities
Where the ratings diverge most
Frequently Asked Questions About Benchmarking Alliance vs M3 (Insight)
Can Benchmarking Alliance replace M3 (Insight)?
It depends on your requirements. Benchmarking Alliance and M3 (Insight) share many core Business Intelligence features, but each has unique capabilities. Benchmarking Alliance offers 18 verified integration partners, while M3 (Insight) offers 39. Review the feature comparison above to see where they differ before switching.
Which is better for small or independent hotels?
Small hotels should prioritize ease of use and fast onboarding. M3 (Insight) leads in ease of use at 4.5/5 vs 0.0/5. Look for transparent pricing and a trial or demo option. Filter reviews on each product page by property size to hear from hotels like yours.
Do Benchmarking Alliance or M3 (Insight) offer a free plan?
Benchmarking Alliance: No. M3 (Insight): No. Neither product currently offers a free tier. Most Business Intelligence vendors offer demos or trials — request one from each to evaluate before committing.
How Does HTR Evaluate and Rank Benchmarking Alliance and M3 (Insight)?
The HT Score is a composite ranking that considers 4 criteria groups and over a dozen variables to help hoteliers objectively compare hotel technology products. Benchmarking Alliance has an HT Score of 0 and M3 has 95. Here is how the score is calculated.
| Criteria Group | Weight | What It Measures |
|---|---|---|
| Customer Ratings & Reviews |
|
How highly do users recommend this product? Ratings Score, Review Volume, Share of Voice, Review Depth, Review Recency, Success Stories ▾ The most heavily weighted factor. Analyzes average satisfaction ratings (likelihood to recommend, ease of use, support, ROI), total review count relative to category peers, review recency (at least 20 reviews in the trailing 6 months), and share of voice across unique hotel clients to detect selection bias. |
| Partner Ecosystem |
|
How highly do tech partners recommend this company? Partner Recommendations, Integration Quantity, Integration Quality ▾ Evaluates partner recommendations as expert votes of confidence, the number of verified integrations, and ecosystem quality — the average HT Scores of integration partners. Products with higher-quality integration ecosystems are more likely to deliver a connected tech stack. |
| Customer Centricity |
|
How customer-centric is this organization? Certified Support, Review Consistency, Profile Completeness ▾ Assesses whether the company has earned HTR Customer Support Certification, maintains consistent review collection over time (an indicator of feedback-driven culture), and keeps product profiles complete with capabilities, screenshots, pricing, and features. |
| Reach, Staying Power & Resources |
|
How extensive is this company's reach and resourcing? Geographic Reach, Staying Power, Company Resources, Trending Score ▾ Measures global presence (countries and regions served), years in business as a stability proxy, team headcount as a resource proxy, and a trending score based on trailing-twelve-month buyer inquiries, reviews, partner recommendations, and press activity. |
Customer ratings and reviews are by far the most important factor in the HT Score algorithm. HTR does not accept payment for higher rankings. All reviews are verified — only hotel industry practitioners with confirmed affiliations can submit ratings. View full HT Score methodology →
What Other Business Intelligence Comparisons Are Hoteliers Reading?
Explore more head-to-head comparisons based on verified hotelier reviews.





Get Your Free AI Analyst Report
Custom recommendations tailored to your property


