

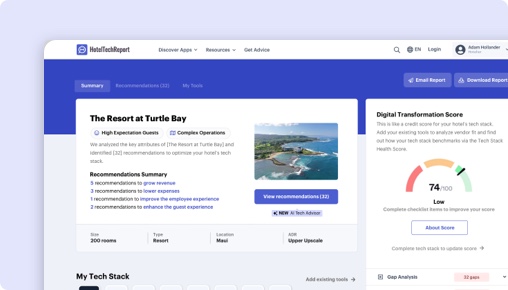
Sorry, this functionality is only available for verified hoteliers
The project dashboard is a free tool that is only available to verified hoteliers to make adopting new technology easier by streamlining their research and simplifying their communication workflow.

BEONx vs. Radiant1:
Which Is Right for You?

TLDR
We analyzed 245 verified hotelier reviews, compared feature sets, pricing, and real-world case studies to break down where each platform delivers. The right choice depends on your property type and priorities:
BEONx shines in dashboard, overview and usability — especially for limited-service properties (4.8/5), with exclusive features like Mobile Friendly Design.
How Does BEONx Compare to Radiant1?
Side-by-side ratings based on 245 verified hotelier reviews on HTR.
| HTScore |
|
|
| Likelihood to Recommend |
|
|
| Ease of Use |
|
|
| Customer Support |
|
|
| Value for Money |
|
|
| Starting Price | From $800/mo | From $400/mo |
| Verified Reviews | 245 | 0 |
What Are the Pros and Cons of BEONx vs Radiant1?
After analyzing 245 verified reviews, BEONx users most value its dashboard, overview and usability, support, onboarding and account guidance, dynamic pricing and rate recommendations, while Radiant1 users highlight . Click any theme to see what reviewers say.
|
BEONx
|
Radiant1
|
|---|---|
| Pros | |
|
+
Dashboard, overview and usability
▾
|
|
|
+
Support, onboarding and account guidance
▾
|
|
|
+
Dynamic pricing and rate recommendations
▾
|
|
|
+
Automation and time savings
▾
|
|
| Cons | |
|
−
Forecasting accuracy and demand prediction
▾
|
|
|
−
Group and event pricing challenges
▾
|
|
Is BEONx or Radiant1 Better for Hotels?
BEONx and Radiant1 both target hotel revenue management but diverge sharply in market presence, feature depth, and proven operational impact. BEONx is a mature, AI-driven revenue management system (RMS) used globally by a variety of hotel segments, with 241 verified reviews at an overall rating of 4.7/5. It focuses on automated pricing optimized for KPIs like RevPAR and Net RevPAR, integrates deeply with PMS and channels, and supports multi-property management with advanced forecasting and analytics.
Radiant1 positions itself as an AI-based RMS combined with channel management and booking engine functionality but lacks verified reviews, case studies, or detailed feature disclosures. Its presence is minimal with only 1 verified integration and no public evidence of operational results. Both products aim to improve revenue through pricing and distribution optimization, but BEONx clearly leads in evidence-backed impact and operational sophistication.
BEONx vs Radiant1: Which Should Your Hotel Choose?
If you operate a hotel portfolio or a single property focused on detailed revenue optimization, especially in competitive markets like Europe, North America, or South America, BEONx stands out with 4.7/5 across 241 reviews, including strong scores in branded hotels (4.7/5, 73 reviews) and city center hotels (4.7/5, 121 reviews). Its AI-driven, multi-KPI approach suits hotels wanting automated dynamic pricing, multi-property dashboards, and advanced competitor intelligence.
Radiant1’s lack of review data and integrations means it may suit smaller or newly adopting properties prioritizing integrated channel management and direct bookings over advanced RMS capabilities. However, this is speculative as no verified user feedback or operational outcomes exist to confirm fit for any hotel segment.
Is BEONx or Radiant1 Easier to Use?
BEONx scores 4.7/5 in ease of use and 4.6/5 in onboarding based on 241 reviews, with users describing the interface as intuitive and visually helpful for revenue teams. Reviewers report smooth adoption across revenue, operations, and front desk teams, though some request clearer graphics and more onboarding documentation.
Radiant1 has no verified reviews or ratings for ease of use or onboarding, leaving its user experience unproven. Without comparable data, the edge for usability cannot be confidently assigned.
Edge: Even.
Which Has Better Features: BEONx or Radiant1?
BEONx offers 69 total features including 28 unique to the product, such as multi-property management, price sensitivity modeling, group pricing and evaluation, displacement analysis, and a five-year forecasting horizon. These features enable hotels to automate pricing across portfolios, analyze market and internal data comprehensively, and forecast long-term demand trends.
Radiant1 discloses no unique features beyond the 41 shared with BEONx. Its primary focus appears to be channel management and booking engine integration rather than advanced RMS capabilities. This limits its operational impact for hotels needing detailed pricing strategies, group/event pricing, or multi-property oversight.
Edge: BEONx.
Which Has Better Customer Support: BEONx or Radiant1?
BEONx holds a 4.8/5 rating in customer support and 4.6/5 for onboarding across 241 reviews. Multiple users praise responsive, knowledgeable account managers who assist with implementation and regular follow-up, accelerating time to value. Reviewers note support is particularly strong in resolving issues rapidly and providing strategic guidance.
Radiant1 lacks any verified customer support ratings or user testimonials. This absence prevents evaluation of support quality, responsiveness, or onboarding efficacy.
Edge: Even.
Which Has More Integrations: BEONx or Radiant1?
BEONx integrates with 30 verified partners including Little Hotelier, Priority Software, Omnibees, RoomRaccoon, apaleo GmbH, Dingus, Fornova, yieldPlanet S.A., and SiteMinder. These integrations cover PMS, channel management, and revenue tools critical to hotel operations globally.
Radiant1 has only 1 verified integration (Little Hotelier), limiting its ability to connect with broader hotel tech ecosystems or support complex operational workflows.
Edge: BEONx.
Which Do Hoteliers Rate Higher: BEONx or Radiant1?
BEONx has 241 reviews with an overall score of 4.7/5 and a last six months average of 4.8/5 across multiple hotel segments. Branded hotels, city center hotels, boutique hotels, and limited service hotels all rate BEONx consistently above 4.6/5. Its likelihood to recommend is 94%.
Radiant1 has no reviews or ratings. Without this data, its operational reliability or performance perception cannot be assessed.
Edge: Even.
How Much Do BEONx and Radiant1 Cost?
BEONx has a base price of $800.00 with no implementation fee or trial period. Pricing is not per room or monthly flat fee but presumably subscription-based.
Radiant1’s base price is $400.00, also without implementation fee or trial. Pricing model details beyond base price are undisclosed.
Given the lack of detailed pricing structures and value demonstration for Radiant1, BEONx’s higher price aligns with its advanced capabilities and verified results.
What Type of Hotel Should Use BEONx?
- Hotels that manage multiple properties and need consolidated pricing and forecasting dashboards.
- Teams aiming to implement AI-driven dynamic pricing focused on maximizing RevPAR and Net RevPAR.
- Properties requiring advanced group and event pricing tools integrated into revenue strategies.
- Revenue managers who value detailed market intelligence and competitor analysis with customizable reporting.
- Hotels prioritizing seamless integration with PMS and channel management systems for operational consistency.
Not ideal if:
- Your hotel needs a simple channel manager or booking engine without complex revenue management.
- You require an RMS with a freemium or trial period for initial evaluation.
- You operate in a market or segment with fewer than five reviews, limiting specific fit data.
What Type of Hotel Should Use Radiant1?
- Properties seeking an all-in-one solution that combines channel management with booking engine capabilities.
- Hotels or small establishments where advanced AI-driven revenue management features are less critical.
- Operators prioritizing a lower base price and simpler technology stack.
Not ideal if:
- You need verified evidence of operational impact or user satisfaction.
- Your revenue team requires advanced forecasting, pricing automation, and multi-property management.
- You rely heavily on PMS and third-party ecosystem integrations.
BEONx vs Radiant1: The Bottom Line for Hotels
BEONx and Radiant1 both serve the revenue management space but differ fundamentally in maturity, functionality, and market validation. BEONx delivers a tested, AI-powered RMS platform with extensive features, integrations, and a proven track record across multiple hotel segments worldwide. Radiant1 offers a combined channel manager and booking engine with RMS claims but lacks user feedback, detailed features, and integrations.
Choose BEONx if your hotel or portfolio demands sophisticated pricing automation, multi-property oversight, and advanced forecasting with strong support and integration. BEONx’s 241 reviews averaging 4.7/5 and 30 integrations provide confidence in operational reliability and ROI.
Choose Radiant1 only if you prioritize a lower entry price and integrated channel management with booking functionality, and you are willing to accept the risk of unproven customer satisfaction and limited RMS features. Its absence of reviews and integrations signals immature market presence.
Feature Comparison: BEONx vs Radiant1
These are the features each vendor has configured, organized by feature group — the same data shown in the vendor dashboard. Expand a group to compare features side by side.
| Feature |
BEONx
|
Radiant1
|
|---|---|---|
|
▾
Pricing Optimization
|
|
|
| Price Explanation | ||
| Enterprise Business Guidelines | ||
| Alternate Stay Date Recommendations | ||
| Alternate Property Reccomendations | ||
| Real-time price optimization | ||
| Dynamic Price Hierarchy Control | ||
| Open Pricing | ||
| Guided workflows | ||
| "What-if" scenario analysis | ||
| Dynamic Pricing | ||
| Set Boundaries | ||
| Manage Exceptions | ||
| Group Pricing | ||
| Manage Restrictions | ||
| Manage Sell-Outs & Cancellations | ||
| Business Mix Optimization | ||
| Define Cycles | ||
| Yield Room Types Individually | ||
| Bulk Adjustments | ||
| 24-Months Pricing & Forecasting | ||
| Component/virtual room pricing | ||
| Extended stay pricing | ||
| Upsell pricing | ||
| Hurdle rate | ||
|
▾
Market Intelligence & Forecasting
|
|
|
| Five-Year Forecasting | ||
| 365-Day Forward Pricing | ||
| STR Data | ||
| 18-Month Forward Pricing | ||
| Price sensitivity modeling | ||
| Multi-Property Dashboard | ||
| Market Intelligence Data | ||
| Interactive Customizable Dashboards | ||
| Future Market Demand Data | ||
| Financial Forecast Builder | ||
| Extended stay forecasting | ||
| Channel forecasting | ||
| Forecast explanation | ||
| Flexible competitor data | ||
|
▾
Dashboards & Reporting
|
|
|
| Custom Reports | ||
| Scheduled Reports | ||
| Lost Business Data | ||
| Analytics dashboard | ||
| Interactive Customizable Dashboards | ||
| Market Insights Reporting | ||
| Pickup Analysis | ||
| Booking Pattern Analysis | ||
| Event Data | ||
| Price Change Logs | ||
| Customizable Notifications & Alerts | ||
| Displacement Analysis | ||
| Group Pricing & Evaluation | ||
| Multi-Property Dashboard | ||
| System benefit measurement | ||
|
▾
Automation
|
|
|
| Controlled Automation/Algorithm Customization | ||
| Automated Room-Type Pricing | ||
| Fully automated revenue management | ||
| Dynamic Pricing | ||
| AI Optimization | ||
| Automatic Pricing Updates | ||
|
▾
Multi-Property Functionality
|
|
|
| Inventory Management | ||
| Multi-property Management | ||
| Multi-Property Dashboard | ||
|
▾
Group Business
|
|
|
| Group Pricing & Evaluation | ||
| "What-if" scenario analysis | ||
| Displacement Analysis | ||
| Group forecast and wash | ||
|
▾
Integrations
|
|
|
| Open API | ||
| Channel Manager | ||
| Business Intelligence | ||
| STR Data | ||
| Property Management System | ||
| Multi-factor authentication | ||
|
▾
Other
|
|
|
| Group pricing & evaluation | ||
| Mobile App | ||
| Smart Spreading Technology | ||
| Single Sign-On | ||
| Mobile Friendly Design |
Real-World Results: BEONx vs Radiant1 by Business Goal
We analyzed 6 verified case studies to compare what hotels actually achieve with each platform across four key business objectives.
HotelAtelier
Small
"Including the HQI™ in the RMS decisions combines demand patterns with quality data, marking a differential value with respect to other systems that do not include this variable in..."
 Radiant1
No published case study for this goal yet.
Grupo Sade: Transforms hotel operations with BEONx
Small
"Grupo Sade’s management highlights the “quick response from the BEONx team during incidents, personalized service, and smooth implementation process” as key elements of their satis..."
 Radiant1
No published case study for this goal yet.
BEONx vs Radiant1: The Bottom Line
What hoteliers love
Users consistently describe the interface as intuitive, visual and easy to navigate, with the Overview screen helping them see key data in one place.... Users consistently describe the interface as intuitive, visual and easy to navigate, with the Overview screen helping them see key data in one place. This usability makes adoption easier across revenue, operations and even front-office teams, though some users want clearer graphics and more customization.
Support is a frequent positive theme, with users praising responsive, knowledgeable account managers and implementation help that speeds adoption. Sev... Support is a frequent positive theme, with users praising responsive, knowledgeable account managers and implementation help that speeds adoption. Several reviews also ask for more onboarding materials, tutorials and clearer explanations so teams can get more value faster and troubleshoot less.
Users most often praise BEONx for producing fast, data-driven rate recommendations that help hotels optimize pricing strategy and react quickly to dem... Users most often praise BEONx for producing fast, data-driven rate recommendations that help hotels optimize pricing strategy and react quickly to demand changes. Many say the recommendations are generally accurate and help improve ADR, RevPAR and overall profitability, though some want less cautious behavior and more flexibility in pricing rules.
Where hoteliers push back
A major theme is forecast quality, especially for occupancy, ADR, revenue and room-night projections that support budget planning and strategic decisi... A major theme is forecast quality, especially for occupancy, ADR, revenue and room-night projections that support budget planning and strategic decisions. Users like the long-term visibility and microsegment-level forecasting, but several note that accuracy can weaken in unusual market conditions, special situations, or longer horizons.
A notable negative topic is the group quotation and event-related functionality, which several users say is not yet strong enough for real-world hotel... A notable negative topic is the group quotation and event-related functionality, which several users say is not yet strong enough for real-world hotel use. They cite unadapted pricing recommendations, missing shoulder-date or F&B logic, limited event detection and insufficient handling of special events, conferences and concerts.
Unique capabilities
Frequently Asked Questions About BEONx vs Radiant1
Can BEONx replace Radiant1?
It depends on your requirements. BEONx and Radiant1 share many core Revenue Management Systems features, but each has unique capabilities. BEONx offers 30 verified integration partners, while Radiant1 offers 1. Review the feature comparison above to see where they differ before switching.
Do BEONx or Radiant1 offer a free plan?
BEONx: No. Radiant1: No. Neither product currently offers a free tier. Most Revenue Management Systems vendors offer demos or trials — request one from each to evaluate before committing.
How Does HTR Evaluate and Rank BEONx and Radiant1?
The HT Score is a composite ranking that considers 4 criteria groups and over a dozen variables to help hoteliers objectively compare hotel technology products. BEONx has an HT Score of 86 and Radiant1 has 0. Here is how the score is calculated.
| Criteria Group | Weight | What It Measures |
|---|---|---|
| Customer Ratings & Reviews |
|
How highly do users recommend this product? Ratings Score, Review Volume, Share of Voice, Review Depth, Review Recency, Success Stories ▾ The most heavily weighted factor. Analyzes average satisfaction ratings (likelihood to recommend, ease of use, support, ROI), total review count relative to category peers, review recency (at least 20 reviews in the trailing 6 months), and share of voice across unique hotel clients to detect selection bias. |
| Partner Ecosystem |
|
How highly do tech partners recommend this company? Partner Recommendations, Integration Quantity, Integration Quality ▾ Evaluates partner recommendations as expert votes of confidence, the number of verified integrations, and ecosystem quality — the average HT Scores of integration partners. Products with higher-quality integration ecosystems are more likely to deliver a connected tech stack. |
| Customer Centricity |
|
How customer-centric is this organization? Certified Support, Review Consistency, Profile Completeness ▾ Assesses whether the company has earned HTR Customer Support Certification, maintains consistent review collection over time (an indicator of feedback-driven culture), and keeps product profiles complete with capabilities, screenshots, pricing, and features. |
| Reach, Staying Power & Resources |
|
How extensive is this company's reach and resourcing? Geographic Reach, Staying Power, Company Resources, Trending Score ▾ Measures global presence (countries and regions served), years in business as a stability proxy, team headcount as a resource proxy, and a trending score based on trailing-twelve-month buyer inquiries, reviews, partner recommendations, and press activity. |
Customer ratings and reviews are by far the most important factor in the HT Score algorithm. HTR does not accept payment for higher rankings. All reviews are verified — only hotel industry practitioners with confirmed affiliations can submit ratings. View full HT Score methodology →
What Other Revenue Management Systems Comparisons Are Hoteliers Reading?
Explore more head-to-head comparisons based on verified hotelier reviews.






Contents
Get Your Free AI Analyst Report
Custom recommendations tailored to your property


Let´s lookup your hotel information
Still weighing your revenue management systems options?
A few popular systems from our revenue management systems guide — or let our AI score each one against your specific property in about two minutes.


