

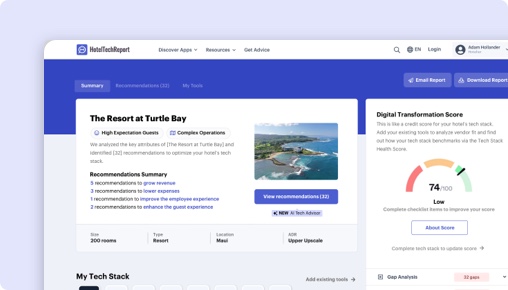
Sorry, this functionality is only available for verified hoteliers
The project dashboard is a free tool that is only available to verified hoteliers to make adopting new technology easier by streamlining their research and simplifying their communication workflow.

happyhotel vs. Radiant1:
Which Is Right for You?


TLDR
We analyzed 216 verified hotelier reviews, compared feature sets, pricing, and real-world case studies to break down where each platform delivers. The right choice depends on your property type and priorities:
happyhotel shines in support, onboarding, and implementation — especially for city-center properties (4.9/5), with exclusive features like Mobile Friendly Design.
Radiant1 stands out with exclusive features like Market Insights Reporting.
How Does happyhotel Compare to Radiant1?
Side-by-side ratings based on 216 verified hotelier reviews on HTR.
| HTScore |
|
|
| Likelihood to Recommend |
|
|
| Ease of Use |
|
|
| Customer Support |
|
|
| Value for Money |
|
|
| Starting Price | From $500/mo | From $400/mo |
| Verified Reviews | 216 | 0 |
What Are the Pros and Cons of happyhotel vs Radiant1?
After analyzing 216 verified reviews, happyhotel users most value its support, onboarding, and implementation, reporting, dashboards, and analytics, revenue impact and time savings, while Radiant1 users highlight . Click any theme to see what reviewers say.
|
happyhotel
|
Radiant1
|
|---|---|
| Pros | |
|
+
Support, onboarding, and implementation
▾
|
|
|
+
Reporting, dashboards, and analytics
▾
|
|
|
+
Revenue impact and time savings
▾
|
|
|
+
Autopilot / automated pricing
▾
|
|
| Cons | |
happyhotel vs Radiant1: Rankings by Hotel Segment
How each product ranks among Revenue Management Systems vendors for different property sizes, types, and regions — based on verified reviews from hoteliers in each segment.
By Hotel Size
| Segment |
happyhotel
|
Radiant1
|
|---|---|---|
| Small (10-24 rooms) ▾ | #4 98 reviews | — |
| Mid-Size (25-74 rooms) ▾ | #7 83 reviews | — |
| Large (75-199 rooms) ▾ | #11 11 reviews | — |
| X-Large (200+ rooms) | #21 1 reviews | — |
By Property Type
| Segment |
happyhotel
|
Radiant1
|
|---|---|---|
| Boutique ▾ | #10 54 reviews | — |
| Luxury ▾ | #16 26 reviews | — |
| Branded / Chain ▾ | #7 33 reviews | — |
| Extended Stay ▾ | #7 23 reviews | — |
By Region
| Segment |
happyhotel
|
Radiant1
|
|---|---|---|
| Europe ▾ | #6 196 reviews | — |
| Asia Pacific | #25 1 reviews | — |
Is happyhotel or Radiant1 Better for Hotels?
Happyhotel and Radiant1 both position themselves within the revenue management system (RMS) category but cater to distinctly different operational needs and market footprints. Happyhotel excels as a cloud-based RMS focused on automated dynamic pricing and forecasting with a strong presence across eight European countries. In contrast, Radiant1 functions more as an all-in-one property management solution with integrated channel management and booking engine capabilities, yet lacks verified reviews or a clear presence in any market.
Happyhotel’s strength lies in automating complex pricing decisions for hotels of all sizes, delivering actionable insights that directly improve revenue and reduce manual workload. Radiant1 offers broader operational tools beyond pricing, targeting inventory and distribution channel management. However, the absence of reviews and real-world feedback for Radiant1 limits confidence in its current effectiveness as a revenue management tool.
Both platforms aim to solve the core hotel problem of optimizing room pricing and availability to maximize bookings and revenue. Happyhotel does this primarily through automation and data-driven price optimization, while Radiant1 combines channel and booking management with pricing controls, though this latter aspect remains unverified by users.
happyhotel vs Radiant1: Which Should Your Hotel Choose?
If you operate a small to medium-sized hotel or a chain in Europe seeking a specialized, proven RMS that automates pricing adjustments and provides detailed forecasting, happyhotel is the clear choice. Its 215 verified reviews, including 50 in the last six months with a steady 4.8/5 rating, demonstrate consistent user satisfaction and ongoing product relevance. Hotels that want to reduce manual rate management and benefit from features like price sensitivity modeling and multi-property management will find happyhotel suited to their needs.
Conversely, if your property requires a broader all-in-one platform combining channel management, booking engine functionality, and some revenue management controls—but you are in a market outside Europe or require a system with unproven RMS capabilities—Radiant1 may be worth exploring, though the lack of reviews, case studies, and verified integration partners means its revenue management features should be approached cautiously until more evidence emerges.
Due to the absence of user feedback and verified ratings, Radiant1’s suitability for any specific hotel segment cannot be confidently determined. Happyhotel’s extensive review base offers detailed insights by segment, confirming its fit for boutique, branded, city center, and luxury hotels, among others, with segment ratings consistently above 4.7/5.
Is happyhotel or Radiant1 Easier to Use?
Happyhotel has an Ease of Use rating of 4.8/5 across 215 reviews, with 50 in the last six months maintaining the same high score. Reviewers praise its intuitive user interface, noting that new employees can quickly learn the system and manage complex revenue management tasks with little training. Onboarding scores average 4.7/5, with users highlighting rapid implementation and clear guidance during setup.
Radiant1 lacks any verified reviews or user feedback, making it impossible to assess ease of use or onboarding quality. Without data from operators or managers, no conclusions can be drawn about how quickly staff adopt Radiant1 or how user-friendly it is on the front line.
Given the comprehensive, recent, and positive feedback for happyhotel versus no data for Radiant1, the edge in ease of use is with happyhotel by default. However, per Hotel Tech Report’s rating edges rules, edges are only called where both have at least 10 reviews, so the formal edge call here is:
Edge: Even.
Which Has Better Features: happyhotel or Radiant1?
Happyhotel offers 33 shared RMS features with Radiant1, plus thirteen unique capabilities that enhance pricing automation and multi-property oversight. These include multi-property management, price sensitivity modeling, financial forecast builder, group pricing and evaluation tools, five-year forecasting, and displacement analysis. For example, happyhotel’s multi-property dashboard enables revenue teams managing multiple locations to optimize pricing strategies centrally, reducing manual coordination and accelerating decision cycles.
Radiant1 provides 33 shared features and 8 unique ones, such as enterprise business guidelines, dynamic price hierarchy control, market insights reporting, and booking pattern analysis. These features target complex business rules and market-level demand insights that can influence higher-level pricing strategies and inventory controls. Radiant1’s ability to manage sell-outs, cancellations, and restrictions supports tighter control over availability and booking conditions.
Operationally, happyhotel’s unique features prioritize automation and revenue optimization through data-driven pricing adjustments and transparent forecasting, benefiting front desk managers and revenue analysts focused on maximizing ADR and occupancy with minimal manual input. Radiant1’s unique features lean more toward integrating revenue management with broader property management functions, offering tools for business mix optimization and dynamic pricing structures that may appeal to enterprise-level hotels with complex booking flows.
Because happyhotel has 13 unique hotel-relevant features compared to Radiant1’s 8, the edge goes to:
Edge: happyhotel.
Which Has Better Customer Support: happyhotel or Radiant1?
Happyhotel scores 4.8/5 for customer support and 4.7/5 for onboarding across 215 reviews, with 50 recent reviews continuing this trend. Numerous reviewers highlight personalized, quick, and competent support that addresses technical and operational questions efficiently. One reviewer noted, “The support team is competent and friendly. They help me quickly and effectively with any questions I have.” Another praised the team for “fantastic working relationships” and “no long waiting times.”
Radiant1 has zero verified reviews, providing no evidence of the quality, responsiveness, or availability of its customer support or onboarding experience.
While the lack of Radiant1 data precludes a direct comparison, the absence of reviews necessitates no edge call per the rules. Therefore:
Edge: Even.
Which Has More Integrations: happyhotel or Radiant1?
Happyhotel integrates with 25 verified partners, including major PMS and channel management platforms such as Opera Cloud, RoomRaccoon, apaleo GmbH, SiteMinder, protel, and Mews. These integrations facilitate real-time data exchange critical for accurate, dynamic pricing updates and synchronized inventory control across channels. For example, happyhotel’s integration with Opera Cloud enables seamless autopilot price changes that front desk and revenue teams can trust without manual overrides.
Radiant1 has only 1 verified integration partner, Little Hotelier, limiting its connectivity and flexibility within the broader hotel technology ecosystem. For hotels relying on multiple distribution and property management systems, Radiant1’s limited integration footprint may restrict operational efficiency and data accuracy.
Since happyhotel has 25 verified partners versus Radiant1’s 1—a difference exceeding 25%—the edge goes decisively to:
Edge: happyhotel.
Which Do Hoteliers Rate Higher: happyhotel or Radiant1?
Happyhotel holds a 4.8/5 overall rating from 215 reviews, including 50 reviews in the last six months maintaining that score. This volume and recency confirm the rating reflects the current product experience. Segment ratings confirm broad satisfaction: city center hotels rate it 4.9/5 across 56 reviews, boutique hotels 4.8/5 from 58 reviews, and airport/conference hotels 4.8/5 from 70 reviews. Bed & breakfasts and inns give it 4.9/5 from 67 reviews, showing strong appeal across diverse property types.
Radiant1 has no reviews or ratings across any hotel segment. No user data exists to validate its performance or acceptance.
Given the strong, recent, and comprehensive feedback for happyhotel contrasted with no data for Radiant1, the edge by rating is:
Edge: happyhotel.
How Much Do happyhotel and Radiant1 Cost?
Happyhotel’s base price is $500.00. It does not offer a freemium version, monthly flat fee, or per-room pricing, and it has no implementation fee or trial period. This straightforward pricing suits hotels prepared to invest in a specialized RMS with proven value.
Radiant1’s base price starts at $400.00, also without freemium, monthly flat, per-room pricing, implementation fees, or trial. Pricing information is limited beyond the base cost, and no trial availability may increase onboarding risk.
While Radiant1’s base price is $100 less, happyhotel’s extensive integration, feature set, and strong review-backed performance justify the premium. Neither product offers transparent tiered pricing or trials, which may challenge some hoteliers’ evaluation processes.
What Type of Hotel Should Use happyhotel?
- Hotels that want proven automated dynamic pricing, as evidenced by 215 reviews with a 4.8/5 rating.
- Teams managing multiple properties needing centralized pricing control via a multi-property dashboard.
- Boutique and city center hotels, which rate happyhotel above 4.8/5 in large review samples.
- Hotels seeking deep forecasting tools, including five-year financial forecasts and displacement analysis.
- Operations that require seamless PMS and channel integrations with 25 verified partners for real-time data sync.
Not ideal if:
- Your hotel requires integrated channel management or booking engine functions bundled with RMS, which happyhotel does not provide.
- You need advanced enterprise business guidelines and booking pattern analysis specific to complex markets (Radiant1 offers these, but unverified).
- You require a free trial before commitment, as happyhotel does not offer one.
What Type of Hotel Should Use Radiant1?
- Hotels seeking a combined property management solution including channel management and booking engine integration.
- Properties looking for business mix optimization and dynamic price hierarchy controls within a single platform.
- Hotels aiming to improve online visibility and booking flow through integrated channel management.
Not ideal if:
- You require a specialized RMS with verified results and extensive integrations; Radiant1 lacks reviews and partner breadth.
- Your hotel depends on transparent, automated pricing driven by real-time data and extensive forecasting.
- You prioritize strong customer support and onboarding based on verified user satisfaction.
happyhotel vs Radiant1: The Bottom Line for Hotels
The core difference between happyhotel and Radiant1 lies in specialization and market validation. Happyhotel is a dedicated revenue management system with extensive automation, forecasting, and integration capabilities, supported by 215 verified reviews and a strong European presence. Radiant1 offers an all-in-one property management solution with some RMS features but lacks user feedback, verified integrations, and a clear market footprint.
Choose happyhotel if your hotel seeks a proven, automation-driven RMS that simplifies pricing decisions and integrates deeply with PMS and channel systems. Its multi-property management, price sensitivity modeling, and forecasting tools deliver measurable revenue improvements and operational efficiency.
Choose Radiant1 if you want a broader platform that combines channel and booking management with RMS functionality and are willing to accept the risk of unvalidated performance. This may suit properties needing integrated booking workflows over specialized revenue management insights.
Overall, happyhotel’s evidence-backed performance and broader feature set make it the more reliable choice for hotels prioritizing revenue management effectiveness. Radiant1 requires further validation before it can compete at this level.
How Much Do happyhotel and Radiant1 Cost?
Revenue Management Systems pricing is rarely straightforward. Here is what we know from each vendor's public pricing data. Always request a custom quote for your property size.
|
happyhotel
|
Radiant1
|
|
|---|---|---|
| Starting Price | From $500/mo | From $400/mo |
Feature Comparison: happyhotel vs Radiant1
These are the features each vendor has configured, organized by feature group — the same data shown in the vendor dashboard. Expand a group to compare features side by side.
| Feature |
happyhotel
|
Radiant1
|
|---|---|---|
|
▾
Pricing Optimization
|
|
|
| Price Explanation | ||
| Enterprise Business Guidelines | ||
| Alternate Stay Date Recommendations | ||
| Alternate Property Reccomendations | ||
| Real-time price optimization | ||
| Dynamic Price Hierarchy Control | ||
| Open Pricing | ||
| Guided workflows | ||
| "What-if" scenario analysis | ||
| Dynamic Pricing | ||
| Set Boundaries | ||
| Manage Exceptions | ||
| Group Pricing | ||
| Manage Restrictions | ||
| Manage Sell-Outs & Cancellations | ||
| Business Mix Optimization | ||
| Define Cycles | ||
| Yield Room Types Individually | ||
| Bulk Adjustments | ||
| 24-Months Pricing & Forecasting | ||
| Component/virtual room pricing | ||
| Extended stay pricing | ||
| Upsell pricing | ||
| Hurdle rate | ||
|
▾
Market Intelligence & Forecasting
|
|
|
| Five-Year Forecasting | ||
| 365-Day Forward Pricing | ||
| STR Data | ||
| 18-Month Forward Pricing | ||
| Price sensitivity modeling | ||
| Multi-Property Dashboard | ||
| Market Intelligence Data | ||
| Interactive Customizable Dashboards | ||
| Future Market Demand Data | ||
| Financial Forecast Builder | ||
| Extended stay forecasting | ||
| Channel forecasting | ||
| Forecast explanation | ||
| Flexible competitor data | ||
|
▾
Dashboards & Reporting
|
|
|
| Custom Reports | ||
| Scheduled Reports | ||
| Lost Business Data | ||
| Analytics dashboard | ||
| Interactive Customizable Dashboards | ||
| Market Insights Reporting | ||
| Pickup Analysis | ||
| Booking Pattern Analysis | ||
| Event Data | ||
| Price Change Logs | ||
| Customizable Notifications & Alerts | ||
| Displacement Analysis | ||
| Group Pricing & Evaluation | ||
| Multi-Property Dashboard | ||
| System benefit measurement | ||
|
▾
Automation
|
|
|
| Controlled Automation/Algorithm Customization | ||
| Automated Room-Type Pricing | ||
| Fully automated revenue management | ||
| Dynamic Pricing | ||
| AI Optimization | ||
| Automatic Pricing Updates | ||
|
▾
Multi-Property Functionality
|
|
|
| Inventory Management | ||
| Multi-property Management | ||
| Multi-Property Dashboard | ||
|
▾
Group Business
|
|
|
| Group Pricing & Evaluation | ||
| "What-if" scenario analysis | ||
| Displacement Analysis | ||
| Group forecast and wash | ||
|
▾
Integrations
|
|
|
| Open API | ||
| Channel Manager | ||
| Business Intelligence | ||
| STR Data | ||
| Property Management System | ||
| Multi-factor authentication | ||
|
▾
Other
|
|
|
| Group pricing & evaluation | ||
| Mobile App | ||
| Smart Spreading Technology | ||
| Single Sign-On | ||
| Mobile Friendly Design |
Real-World Results: happyhotel vs Radiant1 by Business Goal
We analyzed 4 verified case studies to compare what hotels actually achieve with each platform across four key business objectives.
Natur- & Wellnesshotels Brunner Hof 4****S (45 rooms, luxury resort, Germany)
Small
"Before happyhotel, we handled prices manually and tracked everything in Excel. Now we have all key metrics in one place and save a lot of time every day."
 Radiant1
No published case study for this goal yet.
Hotel Öschberghof (127 rooms, luxury resort, Germany)
Small
"Before we started using happyhotel, I manually entered prices into our PMS using self-made Excel sheets. We didn’t have a flexible pricing system and worked with seasonal tables, o..."
 Radiant1
No published case study for this goal yet.
happyhotel vs Radiant1: The Bottom Line
What hoteliers love
Support is a major positive theme: reviewers repeatedly describe onboarding as personal, fast, competent, and solution-oriented. This matters because... Support is a major positive theme: reviewers repeatedly describe onboarding as personal, fast, competent, and solution-oriented. This matters because the product is often adopted by teams new to RMS, and good implementation shortens time-to-value. The main complaints are slower responses in some cases, more training needed for complex setups, and a desire for better guidance during migration or technical configuration.
Users repeatedly value the clear dashboards, customizable charts, and quick access to KPIs, forecasts, RevPAR, ADR, occupancy, and pickup. Happyhotel... Users repeatedly value the clear dashboards, customizable charts, and quick access to KPIs, forecasts, RevPAR, ADR, occupancy, and pickup. Happyhotel is seen as especially helpful for turning complex hotel data into usable daily decisions. Requests for improvement often mention more flexible filters, deeper comparisons, better STLY analysis, and more intuitive report navigation.
A consistent theme is that Happyhotel saves staff time while increasing ADR, occupancy, and overall revenue. Reviewers frequently describe it as a pra... A consistent theme is that Happyhotel saves staff time while increasing ADR, occupancy, and overall revenue. Reviewers frequently describe it as a practical business tool that lets small teams compete more effectively and focus on other tasks. Several note measurable gains, while a smaller group says results depend on setup quality or that benefits took time to appear.
Unique capabilities
Unique capabilities
Frequently Asked Questions About happyhotel vs Radiant1
Can happyhotel replace Radiant1?
It depends on your requirements. happyhotel and Radiant1 share many core Revenue Management Systems features, but each has unique capabilities. happyhotel offers 25 verified integration partners, while Radiant1 offers 1. Review the feature comparison above to see where they differ before switching.
Do happyhotel or Radiant1 offer a free plan?
happyhotel: No. Radiant1: No. Neither product currently offers a free tier. Most Revenue Management Systems vendors offer demos or trials — request one from each to evaluate before committing.
How Does HTR Evaluate and Rank happyhotel and Radiant1?
The HT Score is a composite ranking that considers 4 criteria groups and over a dozen variables to help hoteliers objectively compare hotel technology products. happyhotel has an HT Score of 95 and Radiant1 has 0. Here is how the score is calculated.
| Criteria Group | Weight | What It Measures |
|---|---|---|
| Customer Ratings & Reviews |
|
How highly do users recommend this product? Ratings Score, Review Volume, Share of Voice, Review Depth, Review Recency, Success Stories ▾ The most heavily weighted factor. Analyzes average satisfaction ratings (likelihood to recommend, ease of use, support, ROI), total review count relative to category peers, review recency (at least 20 reviews in the trailing 6 months), and share of voice across unique hotel clients to detect selection bias. |
| Partner Ecosystem |
|
How highly do tech partners recommend this company? Partner Recommendations, Integration Quantity, Integration Quality ▾ Evaluates partner recommendations as expert votes of confidence, the number of verified integrations, and ecosystem quality — the average HT Scores of integration partners. Products with higher-quality integration ecosystems are more likely to deliver a connected tech stack. |
| Customer Centricity |
|
How customer-centric is this organization? Certified Support, Review Consistency, Profile Completeness ▾ Assesses whether the company has earned HTR Customer Support Certification, maintains consistent review collection over time (an indicator of feedback-driven culture), and keeps product profiles complete with capabilities, screenshots, pricing, and features. |
| Reach, Staying Power & Resources |
|
How extensive is this company's reach and resourcing? Geographic Reach, Staying Power, Company Resources, Trending Score ▾ Measures global presence (countries and regions served), years in business as a stability proxy, team headcount as a resource proxy, and a trending score based on trailing-twelve-month buyer inquiries, reviews, partner recommendations, and press activity. |
Customer ratings and reviews are by far the most important factor in the HT Score algorithm. HTR does not accept payment for higher rankings. All reviews are verified — only hotel industry practitioners with confirmed affiliations can submit ratings. View full HT Score methodology →
What Other Revenue Management Systems Comparisons Are Hoteliers Reading?
Explore more head-to-head comparisons based on verified hotelier reviews.




Contents
Get Your Free AI Analyst Report
Custom recommendations tailored to your property


Let´s lookup your hotel information
Still weighing your revenue management systems options?
A few popular systems from our revenue management systems guide — or let our AI score each one against your specific property in about two minutes.


