

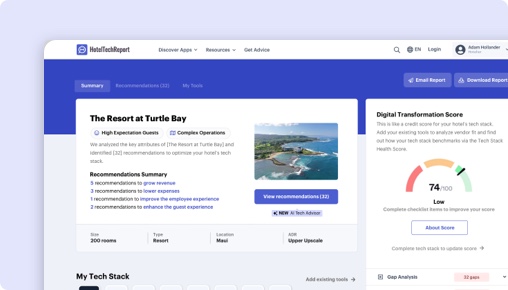
Sorry, this functionality is only available for verified hoteliers
The project dashboard is a free tool that is only available to verified hoteliers to make adopting new technology easier by streamlining their research and simplifying their communication workflow.

FornovaDI (Distribution Intelligence) vs. Magic Parity Tool:
Which Is Right for You?


TLDR
We analyzed 62 verified hotelier reviews, compared feature sets, pricing, and real-world case studies to break down where each platform delivers. The right choice depends on your property type and priorities:
Fornova shines in rate parity monitoring — especially for branded chain properties (4.7/5).
How Does FornovaDI (Distribution Intelligence) Compare to Magic Parity Tool?
Side-by-side ratings based on 62 verified hotelier reviews on HTR.
| HTScore |
|
|
| Likelihood to Recommend |
|
|
| Ease of Use |
|
|
| Customer Support |
|
|
| Value for Money |
|
|
| Starting Price | Contact sales | Contact sales |
| Verified Reviews | 62 | 0 |
What Are the Pros and Cons of FornovaDI (Distribution Intelligence) vs Magic Parity Tool?
After analyzing 62 verified reviews, Fornova users most value its rate parity monitoring, customer service & technical support, detailed reporting, while 123compare.me users highlight . Click any theme to see what reviewers say.
|
Fornova
|
123compare.me
|
|---|---|
| Pros | |
|
+
Rate Parity Monitoring
▾
|
|
|
+
Customer Service & Technical Support
▾
|
|
|
+
Detailed Reporting
▾
|
|
|
+
POS Shopping Tool
▾
|
|
| Cons | |
|
−
Latency and Integration
▾
|
|
Fornova vs 123compare.me: Rankings by Hotel Segment
How each product ranks among Hotel Rate Parity vendors for different property sizes, types, and regions — based on verified reviews from hoteliers in each segment.
By Hotel Size
| Segment |
Fornova
|
123compare.me
|
|---|---|---|
| Small (10-24 rooms) | #7 2 reviews | — |
| Mid-Size (25-74 rooms) ▾ | #4 17 reviews | — |
| Large (75-199 rooms) ▾ | #3 28 reviews | — |
| X-Large (200+ rooms) ▾ | #4 8 reviews | — |
By Property Type
| Segment |
Fornova
|
123compare.me
|
|---|---|---|
| Boutique ▾ | #5 26 reviews | — |
| Luxury ▾ | #4 37 reviews | — |
| Branded / Chain ▾ | #3 29 reviews | — |
| Extended Stay | #4 4 reviews | — |
By Region
| Segment |
Fornova
|
123compare.me
|
|---|---|---|
| North America ▾ | #4 6 reviews | — |
| Europe ▾ | #6 10 reviews | — |
| Asia Pacific ▾ | #3 33 reviews | — |
| Middle East ▾ | #3 5 reviews | — |
Is FornovaDI or Magic Parity Tool Better for Hotels?
Both FornovaDI and Magic Parity Tool aim to solve hotel rate parity challenges by identifying and addressing OTA undercutting to protect your direct bookings and revenue. FornovaDI focuses on continuous distribution health monitoring and benchmarking across direct and indirect channels, offering detailed reports, test bookings, and POS analysis. Magic Parity Tool analyzes real guest search data on your website to detect undercutting in real time, emphasizing immediate business impact and corrective actions.
Where they diverge is in their approach: FornovaDI provides a broad, data-rich platform suited for chains wanting deep insights and benchmarking, while Magic Parity Tool targets more immediate, real-time disparity detection without complex integrations. But which approach offers better confidence and results for your hotel’s needs?
FornovaDI vs Magic Parity Tool: Which Should Your Hotel Choose?
If your hotel operates as part of a chain or group that values comprehensive distribution intelligence with detailed rate parity benchmarking and in-depth reporting, FornovaDI is the stronger choice. It suits hotels that want to track performance across multiple OTAs and POS, with advanced test booking capabilities and a history of positive user feedback.
Conversely, if your hotel is independent or smaller in scale and needs a lightweight, real-time tool that detects parity gaps during guest searches on your site without requiring PMS or booking engine integration, Magic Parity Tool might appeal. However, lacking any user reviews or ratings, the confidence in its performance is unproven compared to FornovaDI’s established presence.
Is FornovaDI or Magic Parity Tool Easier to Use?
FornovaDI scores an impressive 4.56/5 for ease of use, reflecting the intuitive interface and friendly dashboard navigation repeatedly praised in reviews. Users appreciate the visual clarity of its virtual diagrams and accessible data presentation. Onboarding scores 4.45/5 further reinforce that your team can adapt quickly with FornovaDI, supported by training sessions and responsive support.
Magic Parity Tool has no available ratings or user feedback on ease of use, making it impossible to judge how your staff would adopt the system or how smooth the onboarding process is. Without this data, FornovaDI clearly holds the advantage for usability and user experience.
Edge: FornovaDI.
Which Has Better Features: FornovaDI or Magic Parity Tool?
Neither product lists overlapping features, and regrettably, no feature counts are available beyond descriptions. FornovaDI’s standout features include test bookings that generate concrete proof of rate violations, POS shopping tools that dissect disparities by channel and region, and detailed scoring and analytics for distribution health. These help you pinpoint root causes and optimize revenue.
Magic Parity Tool claims a unique approach by analyzing parity during actual guest searches on your website, measuring real-time conversion impacts and integrating corrective tools like Find & Book and Price Match. This real-time, demand-based parity monitoring is not mentioned in FornovaDI’s feature set.
However, without user reviews or evidence of feature effectiveness for Magic Parity Tool, FornovaDI’s mature, well-documented feature portfolio provides more reliable operational value.
Edge: FornovaDI.
Which Has Better Customer Support: FornovaDI or Magic Parity Tool?
FornovaDI boasts a 4.73/5 customer support rating and multiple reviews praising its support team’s responsiveness, expertise, and willingness to tailor solutions. Reviewers mention timely resolution of issues and proactive account management, enhancing your team’s confidence in ongoing assistance.
Magic Parity Tool lacks any customer support ratings or reviews, so the quality and responsiveness of its support remain unknown. This absence is critical when evaluating a software that requires reliable troubleshooting and guidance to protect your revenue effectively.
Edge: FornovaDI.
Which Has More Integrations: FornovaDI or Magic Parity Tool?
123compare.me’s Magic Parity Tool offers 25 verified integrations, including partners like Mirai, Dingus, GuestCentric, Bookassist, and SiteMinder, giving your hotel access to a broad ecosystem. It shares only three partners with FornovaDI, such as myCloud Hospitality PMS and Mews.
FornovaDI has 8 verified integrations, including Oracle Hospitality, RMS, and Duetto, which are strong names in hotel technology but fewer in total number. The breadth of 123compare.me’s integration network could provide more flexibility if your hotel relies on diverse or niche systems.
Edge: Magic Parity Tool.
Which Do Hoteliers Rate Higher: FornovaDI or Magic Parity Tool?
FornovaDI has 58 reviews with an overall rating of 4.75/5, reflecting consistently high satisfaction across hotel segments, including Luxury (4.74/5), Boutique (4.86/5), and City Center Hotels (4.76/5). Its reviews are mostly recent and detailed, indicating active user engagement and reliable performance.
Magic Parity Tool has zero reviews, no ratings, and no reported user feedback. This lack of data means you cannot verify its user satisfaction or suitability for different hotel types based on peer experience.
Edge: FornovaDI.
How Much Do FornovaDI and Magic Parity Tool Cost?
Neither FornovaDI nor Magic Parity Tool publicly disclose base pricing, monthly fees, or implementation costs. Both lack freemium or trial options, meaning you would need to contact sales directly for a custom quote.
Without transparent pricing information, your evaluation should focus on product fit, features, and support rather than cost comparisons.
What Type of Hotel Should Use FornovaDI?
- Hotels that operate as part of chains or groups needing comprehensive distribution health monitoring.
- Teams that require detailed rate parity benchmarking and root cause analysis.
- Hotels prioritizing direct booking growth with test booking and POS shopping tools.
- Properties wanting extensive reporting and actionable insights to optimize revenue.
- Hotels valuing strong customer support and ongoing training.
Not ideal if:
- Your hotel prefers lightweight, real-time tools without complex integrations.
- You have limited budget transparency and need clear pricing upfront.
What Type of Hotel Should Use Magic Parity Tool?
- Independent hotels or smaller groups seeking real-time parity gap detection during guest website searches.
- Teams needing a lightweight solution without PMS or booking engine integrations.
- Hotels looking for broad integration options with 25 verified partners.
- Properties interested in automated corrective actions integrated with booking tools.
Not ideal if:
- You require proven user satisfaction and extensive customer support.
- You depend on deep benchmarking and detailed distribution health analytics.
- Your team values training and onboarding backed by extensive reviews.
FornovaDI vs Magic Parity Tool: The Bottom Line for Hotels
The core difference is that FornovaDI offers a mature, review-backed platform focused on comprehensive distribution intelligence and actionable insights, while Magic Parity Tool promises real-time, demand-based rate parity detection but lacks user validation. FornovaDI’s strength lies in its tested features like test bookings, POS tools, and high-quality customer support, making it a trusted choice for hotels aiming to control rate leakage and improve direct bookings.
Choose FornovaDI if your hotel values in-depth analytics, extensive customer support, and has a chain or group structure that benefits from benchmarking across multiple OTAs and POS. Its 58 positive reviews and high ease of use scores demonstrate a reliable, proven solution for revenue and distribution optimization.
Opt for Magic Parity Tool only if you prioritize a lightweight, real-time parity tool with broad integrations and operate independently or in smaller groups. However, the absence of reviews and support ratings means you take on more risk with an unproven product in the hotel tech landscape.
In this comparison, FornovaDI is the definitive stronger pick for hotels looking for confidence, comprehensive functionality, and proven success.
How Much Do FornovaDI (Distribution Intelligence) and Magic Parity Tool Cost?
Hotel Rate Parity pricing is rarely straightforward. Here is what we know from each vendor's public pricing data. Always request a custom quote for your property size.
|
Fornova
|
123compare.me
|
|---|
Fornova vs 123compare.me: The Bottom Line
What hoteliers love
Fornova excels in monitoring rate parity, allowing hotels to swiftly identify rate discrepancies across multiple channels, including OTAs and metasear... Fornova excels in monitoring rate parity, allowing hotels to swiftly identify rate discrepancies across multiple channels, including OTAs and metasearch sites. Users value its daily rate shopping and disparity detection that help maintain consistent pricing, thus increasing direct bookings and reducing revenue leakage. Features like test bookings and POS tools are highly praised for their effectiveness in resolving rate violations.
The support team at Fornova is frequently praised for being responsive, knowledgeable, and willing to integrate user feedback into improvements. Thoug... The support team at Fornova is frequently praised for being responsive, knowledgeable, and willing to integrate user feedback into improvements. Though the support is generally well-received, a few reviews suggested enhancements in support turnaround times and more intuitive help guides.
Users value Fornova’s detailed and insightful reports that provide visual interpretations of rate parity, distribution health, and other key metrics.... Users value Fornova’s detailed and insightful reports that provide visual interpretations of rate parity, distribution health, and other key metrics. These reports help in quickly identifying trends and issues, making it easier for hotels to act promptly. Some users noted a desire for more customizable reporting options.
Where hoteliers push back
While Fornova's toolset is robust and feature-rich, some users experience latency issues, especially when working with larger datasets. Additionally,... While Fornova's toolset is robust and feature-rich, some users experience latency issues, especially when working with larger datasets. Additionally, there are calls for better integration with other systems to streamline the user experience and make for smoother report generation.
Frequently Asked Questions About FornovaDI (Distribution Intelligence) vs Magic Parity Tool
Can FornovaDI (Distribution Intelligence) replace Magic Parity Tool?
It depends on your requirements. FornovaDI (Distribution Intelligence) and Magic Parity Tool share many core Hotel Rate Parity features, but each has unique capabilities. FornovaDI (Distribution Intelligence) offers 8 verified integration partners, while Magic Parity Tool offers 25. Review the feature comparison above to see where they differ before switching.
Do FornovaDI (Distribution Intelligence) or Magic Parity Tool offer a free plan?
FornovaDI (Distribution Intelligence): No. Magic Parity Tool: No. Neither product currently offers a free tier. Most Hotel Rate Parity vendors offer demos or trials — request one from each to evaluate before committing.
How Does HTR Evaluate and Rank FornovaDI (Distribution Intelligence) and Magic Parity Tool?
The HT Score is a composite ranking that considers 4 criteria groups and over a dozen variables to help hoteliers objectively compare hotel technology products. Fornova has an HT Score of 22 and 123compare.me has 0. Here is how the score is calculated.
| Criteria Group | Weight | What It Measures |
|---|---|---|
| Customer Ratings & Reviews |
|
How highly do users recommend this product? Ratings Score, Review Volume, Share of Voice, Review Depth, Review Recency, Success Stories ▾ The most heavily weighted factor. Analyzes average satisfaction ratings (likelihood to recommend, ease of use, support, ROI), total review count relative to category peers, review recency (at least 20 reviews in the trailing 6 months), and share of voice across unique hotel clients to detect selection bias. |
| Partner Ecosystem |
|
How highly do tech partners recommend this company? Partner Recommendations, Integration Quantity, Integration Quality ▾ Evaluates partner recommendations as expert votes of confidence, the number of verified integrations, and ecosystem quality — the average HT Scores of integration partners. Products with higher-quality integration ecosystems are more likely to deliver a connected tech stack. |
| Customer Centricity |
|
How customer-centric is this organization? Certified Support, Review Consistency, Profile Completeness ▾ Assesses whether the company has earned HTR Customer Support Certification, maintains consistent review collection over time (an indicator of feedback-driven culture), and keeps product profiles complete with capabilities, screenshots, pricing, and features. |
| Reach, Staying Power & Resources |
|
How extensive is this company's reach and resourcing? Geographic Reach, Staying Power, Company Resources, Trending Score ▾ Measures global presence (countries and regions served), years in business as a stability proxy, team headcount as a resource proxy, and a trending score based on trailing-twelve-month buyer inquiries, reviews, partner recommendations, and press activity. |
Customer ratings and reviews are by far the most important factor in the HT Score algorithm. HTR does not accept payment for higher rankings. All reviews are verified — only hotel industry practitioners with confirmed affiliations can submit ratings. View full HT Score methodology →
What Other Hotel Rate Parity Comparisons Are Hoteliers Reading?
Explore more head-to-head comparisons based on verified hotelier reviews.



Contents
Get Your Free AI Analyst Report
Custom recommendations tailored to your property


