

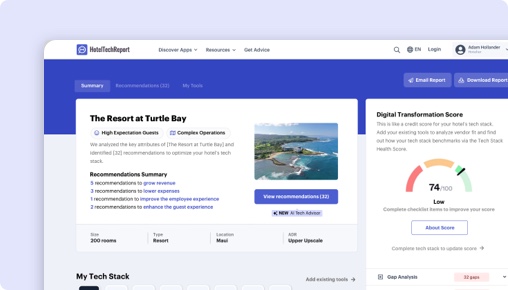
Sorry, this functionality is only available for verified hoteliers
The project dashboard is a free tool that is only available to verified hoteliers to make adopting new technology easier by streamlining their research and simplifying their communication workflow.

happyhotel vs. N2Pricing by Revenue Analytics:
Which Is Right for You?

TLDR
We analyzed 227 verified hotelier reviews, compared feature sets, pricing, and real-world case studies to break down where each platform delivers. The right choice depends on your property type and priorities:
happyhotel shines when it comes to support and onboarding service , with exclusive features like Mobile Friendly Design.
Revenue Analytics shines in ROI , with exclusive features like Market Insights Reporting.
How Does happyhotel Compare to N2Pricing by Revenue Analytics?
Side-by-side ratings based on 227 verified hotelier reviews on HTR.
| HTScore |
|
|
| Likelihood to Recommend |
|
|
| Ease of Use |
|
|
| Customer Support |
|
|
| Value for Money |
|
|
| Starting Price | From $500/mo | From $500/mo |
| Verified Reviews | 197 | 30 |
What Are the Pros and Cons of happyhotel vs N2Pricing by Revenue Analytics?
After analyzing 227 verified reviews, happyhotel users most value its support and onboarding service, dynamic pricing automation, reporting, dashboards and analytics, while Revenue Analytics users highlight automated pricing and revenue optimization, user-friendly interface, real-time market adaptation. Click any theme to see what reviewers say.
|
happyhotel
|
Revenue Analytics
|
|---|---|
| Pros | |
|
+
Support and onboarding service
▾
|
+
Automated Pricing and Revenue Optimization
▾
|
|
+
Dynamic pricing automation
▾
|
+
User-Friendly Interface
▾
|
|
+
Reporting, dashboards and analytics
▾
|
+
Real-Time Market Adaptation
▾
|
|
+
Ease of use and onboarding
▾
|
+
Strategic Decision-Making Support
▾
|
| Cons | |
|
−
Price recommendation transparency and control
▾
|
−
Dynamic Differential and Hurdle Points
▾
|
|
−
Reporting and Data Visualization
▾
|
|
|
−
Mobile Accessibility
▾
|
|
happyhotel vs Revenue Analytics: Rankings by Hotel Segment
How each product ranks among Revenue Management Systems vendors for different property sizes, types, and regions — based on verified reviews from hoteliers in each segment.
By Hotel Size
| Segment |
happyhotel
|
Revenue Analytics
|
|---|---|---|
| Small (10-24 rooms) ▾ | #9 55 reviews | #44 1 reviews |
| Mid-Size (25-74 rooms) ▾ | #7 77 reviews | #13 21 reviews |
| Large (75-199 rooms) ▾ | #31 1 reviews | #12 6 reviews |
| X-Large (200+ rooms) | #15 2 reviews | #19 1 reviews |
By Property Type
| Segment |
happyhotel
|
Revenue Analytics
|
|---|---|---|
| Boutique ▾ | #13 36 reviews | #25 15 reviews |
| Luxury ▾ | #17 23 reviews | #32 5 reviews |
| Branded / Chain ▾ | #13 23 reviews | #7 27 reviews |
| Extended Stay ▾ | #9 18 reviews | #15 5 reviews |
By Region
| Segment |
happyhotel
|
Revenue Analytics
|
|---|---|---|
| North America ▾ | — | #8 24 reviews |
| Europe ▾ | #9 139 reviews | #38 1 reviews |
| Asia Pacific | #23 1 reviews | — |
| Middle East | — | #18 2 reviews |
The Decision
Choosing between happyhotel by happyhotel and N2Pricing by Revenue Analytics hinges on your hotel’s specific needs, size, and growth ambitions. Both systems aim to optimize your revenue and streamline pricing decisions, but they differ significantly in user experience, features, and recent market traction.
happyhotel has established a strong reputation with over 150 reviews, most recent within the last six months, and a high HTR score of 92.48. Conversely, Revenue Analytics’s N2Pricing has fewer reviews (just 29) with no recent feedback, and a lower overall rating of 77.89. This makes happyhotel the more data-backed, proven choice for most hoteliers today.
Is happyhotel or N2Pricing Better for Hotels?
happyhotel and N2Pricing aim to automate and improve revenue management through data-driven pricing strategies. Both platforms address manual effort reduction and revenue maximization, but their approach and maturity differ.
happyhotel shines with its user-friendly, intuitive interface, making complex data accessible even for smaller hotels or teams with limited revenue management experience. It’s praised for quick onboarding, seamless PMS integration, and automation that saves hours daily. Revenue Analytics’s N2Pricing, while offering advanced forecasting and automation, has a more technical interface that might require a steeper learning curve, and it lacks recent user reviews for validation.
In terms of problem-solving, happyhotel’s automation and real-time data help optimize occupancy and revenue with less manual intervention, making it ideal during staffing shortages or operational cost increases. N2Pricing offers sophisticated market reaction features and detailed analytics but appears less tested in recent months, which could influence your confidence. Do you prioritize proven results and ease of use over advanced customization?
happyhotel vs N2Pricing: Which Should Your Hotel Choose?
If your hotel needs a straightforward, reliable revenue management system with high user satisfaction, go with happyhotel. It’s best suited for small to medium-sized hotels, owners, or properties seeking automation without complexity, especially if you value quick setup, strong integrations, and a 5-star overall rating.
If you are part of a larger hotel group or need granular control over pricing strategies, multiple data points, and detailed forecasting tools, N2Pricing might appeal—assuming you're willing to navigate its less recent reviews. However, given the current market data, happyhotel’s more extensive review base and recent positive feedback make it the safer, more validated choice.
Is happyhotel or N2Pricing Easier to Use?
happyhotel has an impressive ease of use rating of 4.77/5, supported by consistent praise for its intuitive interface and quick onboarding process. Many users highlight how even non-technical staff can adopt it rapidly, with reviews emphasizing “simple setup” and “clear visualizations” that make daily operations smoother.
N2Pricing boasts a perfect 5/5 ease of use rating, but the limited recent reviews mean this might not reflect current user experiences accurately. Users do mention that the platform is “easy to navigate” and “helps with decision-making,” but some also report challenges on mobile devices, with less user-friendliness on smartphones.
Edge: happyhotel.
Which Has Better Features: happyhotel or N2Pricing?
happyhotel offers 36 shared features, including open API access, custom reports, a financial forecast builder, group pricing, interactive dashboards, and a mobile-friendly design. Its unique features include a single sign-on, event data analysis, and the ability to enter custom data in calendars, providing flexibility for smaller teams.
Revenue Analytics offers 12 unique features, such as price explanation, inventory management, business mix optimization, market insights, booking pattern analysis, and automated management of sell-outs and cancellations. Its strength lies in sophisticated demand forecasting and multi-property management.
happyhotel’s broader feature set, especially with tools like custom dashboards and mobile compatibility, gives it the edge for hotels needing a flexible, all-in-one solution.
Edge: happyhotel.
Which Has Better Customer Support: happyhotel or N2Pricing?
happyhotel’s customer support is rated 4.81/5, with reviewers praising the “personalized, quick responses” and “hands-on onboarding” that helps hotels feel confident from day one. Many mention the dedicated support team’s ongoing engagement, which contributes to high satisfaction.
Revenue Analytics’s support scores slightly higher at 4.86/5, with users appreciating “seamless implementation” and “responsive communication.” However, the limited reviews and absence of recent feedback make it harder to assess current support quality.
Edge: happyhotel.
Which Has More Integrations: happyhotel or N2Pricing?
happyhotel integrates with 24 verified partners, including major PMS and channel management systems like SiteMinder, Mews, Oracle Hospitality, and others. Its open API allows further customization, making it adaptable to various hotel tech stacks.
N2Pricing has 8 verified integrations—fewer than happyhotel—covering key systems like RMS, Stayntouch, Cloudbeds, and ReservHOTEL. Its more limited partner list might restrict flexibility for complex or multi-system setups.
Edge: happyhotel.
Which Do Hoteliers Rate Higher: happyhotel or N2Pricing?
happyhotel’s overall review score of 5/5 from 151 reviews indicates widespread satisfaction, with most recent reviews being highly positive. Hotels of various sizes, especially city center and boutique hotels, praise its simplicity, automation, and customer service.
N2Pricing has only 25 reviews, with no recent feedback, and a lower overall rating of 77.89. Its users, mainly larger branded hotels, appreciate the automation but express some frustration about manual oversight and less intuitive workflows.
Edge: happyhotel.
How Much Do happyhotel and N2Pricing Cost?
Both products are priced at $500 monthly, with no mention of implementation fees or trial periods. Since prices are equal, your decision should hinge on feature set, user reviews, and support quality rather than cost.
What Type of Hotel Should Use happyhotel?
- Hotels that want an easy-to-implement system with high user satisfaction.
- Small to medium-sized properties needing automation without complex customization.
- Hotels seeking seamless PMS integrations and a mobile-friendly interface.
- Teams that prefer a proven platform with recent, positive reviews.
- Hotels that value strong vendor support and quick onboarding.
Not ideal if your hotel requires highly granular or custom market insights, or if you operate at a scale demanding more advanced features not yet in happyhotel.
What Type of Hotel Should Use N2Pricing?
- Larger hotel groups or properties with extensive data analysis needs.
- Teams that want detailed demand forecasting and advanced yield management.
- Hotels with existing systems that can benefit from N2Pricing’s integrations.
- Revenue managers looking for automation combined with strategic flexibility.
- Hotels comfortable with a platform that may have less recent validation and a more technical interface.
Not ideal if you need quick setup, proven recent performance, or user-friendly mobile access.
The Bottom Line for Hotels
happyhotel and N2Pricing serve different hotel segments, with happyhotel leading in recent reviews, overall satisfaction, and feature breadth. Its high HTR score of 92.48, extensive positive feedback, and quick onboarding make it a dependable choice for most hoteliers today.
N2Pricing offers strong automation and forecasting tools but suffers from a lack of recent validation, which might impact confidence in its current performance. It’s more suited for larger properties or groups with complex revenue strategies willing to navigate a more technical platform.
For hotels seeking proven, user-friendly revenue management, happyhotel is the clear pick. Its recent reviews, high ratings, and comprehensive features make it the most reliable solution in today’s market.
How Much Do happyhotel and N2Pricing by Revenue Analytics Cost?
Revenue Management Systems pricing is rarely straightforward. Here is what we know from each vendor's public pricing data. Always request a custom quote for your property size.
|
happyhotel
|
Revenue Analytics
|
|
|---|---|---|
| Starting Price | From $500/mo | From $500/mo |
Feature Comparison: happyhotel vs N2Pricing by Revenue Analytics
These are the features each vendor has configured, organized by feature group — the same data shown in the vendor dashboard. Expand a group to compare features side by side.
| Feature |
happyhotel
|
Revenue Analytics
|
|---|---|---|
|
▾
Pricing Optimization
|
|
|
| Price Explanation | ||
| Enterprise Business Guidelines | ||
| Alternate Stay Date Recommendations | ||
| Alternate Property Reccomendations | ||
| Real-time price optimization | ||
| Dynamic Price Hierarchy Control | ||
| Open Pricing | ||
| Guided workflows | ||
| "What-if" scenario analysis | ||
| Dynamic Pricing | ||
| Set Boundaries | ||
| Manage Exceptions | ||
| Group Pricing | ||
| Manage Restrictions | ||
| Manage Sell-Outs & Cancellations | ||
| Business Mix Optimization | ||
| Define Cycles | ||
| Yield Room Types Individually | ||
| Bulk Adjustments | ||
| 24-Months Pricing & Forecasting | ||
| Component/virtual room pricing | ||
| Extended stay pricing | ||
| Upsell pricing | ||
| Hurdle rate | ||
|
▾
Market Intelligence & Forecasting
|
|
|
| Five-Year Forecasting | ||
| 365-Day Forward Pricing | ||
| STR Data | ||
| 18-Month Forward Pricing | ||
| Price sensitivity modeling | ||
| Multi-Property Dashboard | ||
| Market Intelligence Data | ||
| Interactive Customizable Dashboards | ||
| Future Market Demand Data | ||
| Financial Forecast Builder | ||
| Extended stay forecasting | ||
| Channel forecasting | ||
| Forecast explanation | ||
| Flexible competitor data | ||
|
▾
Dashboards & Reporting
|
|
|
| Custom Reports | ||
| Scheduled Reports | ||
| Lost Business Data | ||
| Analytics dashboard | ||
| Interactive Customizable Dashboards | ||
| Market Insights Reporting | ||
| Pickup Analysis | ||
| Booking Pattern Analysis | ||
| Event Data | ||
| Price Change Logs | ||
| Customizable Notifications & Alerts | ||
| Displacement Analysis | ||
| Group Pricing & Evaluation | ||
| Multi-Property Dashboard | ||
| System benefit measurement | ||
|
▾
Automation
|
|
|
| Controlled Automation/Algorithm Customization | ||
| Automated Room-Type Pricing | ||
| Fully automated revenue management | ||
| Dynamic Pricing | ||
| AI Optimization | ||
| Automatic Pricing Updates | ||
|
▾
Multi-Property Functionality
|
|
|
| Inventory Management | ||
| Multi-property Management | ||
| Multi-Property Dashboard | ||
|
▾
Group Business
|
|
|
| Group Pricing & Evaluation | ||
| "What-if" scenario analysis | ||
| Displacement Analysis | ||
| Group forecast and wash | ||
|
▾
Integrations
|
|
|
| Open API | ||
| Channel Manager | ||
| Business Intelligence | ||
| STR Data | ||
| Property Management System | ||
| Multi-factor authentication | ||
|
▾
Other
|
|
|
| Group pricing & evaluation | ||
| Mobile App | ||
| Smart Spreading Technology | ||
| Single Sign-On | ||
| Mobile Friendly Design |
Real-World Results: happyhotel vs Revenue Analytics by Business Goal
We analyzed 4 verified case studies to compare what hotels actually achieve with each platform across four key business objectives.
Natur- & Wellnesshotels Brunner Hof 4****S (45 rooms, luxury resort, Germany)
Small
"Before happyhotel, we handled prices manually and tracked everything in Excel. Now we have all key metrics in one place and save a lot of time every day."
 Revenue Analytics
No published case study for this goal yet.
Hotel Öschberghof (127 rooms, luxury resort, Germany)
Small
"Before we started using happyhotel, I manually entered prices into our PMS using self-made Excel sheets. We didn’t have a flexible pricing system and worked with seasonal tables, o..."
 Revenue Analytics
No published case study for this goal yet.
happyhotel vs Revenue Analytics: The Bottom Line
What hoteliers love
Support is one of HappyHotel’s strongest themes: reviewers consistently describe the team as fast, competent, friendly and solution-oriented, especial... Support is one of HappyHotel’s strongest themes: reviewers consistently describe the team as fast, competent, friendly and solution-oriented, especially during onboarding and troubleshooting. The main criticism is not the quality of help, but responsiveness or access channels, with some asking for faster feedback, better phone availability or improved communication.
Users most often say HappyHotel automates rate changes based on demand, occupancy, booking pace and market conditions, reducing manual work and helpin... Users most often say HappyHotel automates rate changes based on demand, occupancy, booking pace and market conditions, reducing manual work and helping hotels capture more revenue. Many note that autopilot pricing is reliable and frees staff to focus elsewhere, while still allowing manual overrides when needed.
Many reviewers highlight clear dashboards, KPI visibility and useful reports that make revenue management easier to understand and act on. At the same... Many reviewers highlight clear dashboards, KPI visibility and useful reports that make revenue management easier to understand and act on. At the same time, users often ask for more flexible filters, custom metrics, deeper comparisons and more polished analysis views, especially for advanced hotel structures.
Where hoteliers push back
Several users want more visibility into how recommendations are calculated and more control over algorithm behavior, especially for derived rates and... Several users want more visibility into how recommendations are calculated and more control over algorithm behavior, especially for derived rates and custom pricing rules. While many trust the system after using it, reviewers still ask for explainability, adjustable aggressiveness, custom algorithms and better handling of single/double or category-based surcharges.
Ranks higher for
Unique capabilities
What hoteliers love
Users praise N2's ability to adjust rates automatically based on complex data analysis, ensuring no opportunities are missed. This has driven higher r... Users praise N2's ability to adjust rates automatically based on complex data analysis, ensuring no opportunities are missed. This has driven higher revenue and reduced the need for manual interventions, allowing hoteliers to focus on other strategic areas.
N2 is consistently praised for its ease of use and intuitive nature, helping even new users quickly adapt and make informed decisions. The straightfor... N2 is consistently praised for its ease of use and intuitive nature, helping even new users quickly adapt and make informed decisions. The straightforward interface reduces training time and facilitates easier navigation and adoption.
N2's real-time analysis of market changes and its ability to react dynamically is highly commended. This feature ensures the hotels stay ahead of mark... N2's real-time analysis of market changes and its ability to react dynamically is highly commended. This feature ensures the hotels stay ahead of market trends and enhances their revenue management capabilities with minimal oversight.
Where hoteliers push back
Dynamic rate adjustment and management of hurdle points are key strengths, but users express difficulties with optimization, requiring ongoing manual... Dynamic rate adjustment and management of hurdle points are key strengths, but users express difficulties with optimization, requiring ongoing manual oversight. Improvement in this area would heighten overall satisfaction and operational efficacy.
While appreciated for its comprehensive data presentation, users suggest enhancements in the clarity and delivery of reports could further improve the... While appreciated for its comprehensive data presentation, users suggest enhancements in the clarity and delivery of reports could further improve their utility and eliminate inbox clutter.
Ranks higher for
Unique capabilities
Where the ratings diverge most
Frequently Asked Questions About happyhotel vs N2Pricing by Revenue Analytics
Can happyhotel replace N2Pricing by Revenue Analytics?
It depends on your requirements. happyhotel and N2Pricing by Revenue Analytics share many core Revenue Management Systems features, but each has unique capabilities. happyhotel offers 24 verified integration partners, while N2Pricing by Revenue Analytics offers 10. Review the feature comparison above to see where they differ before switching.
Which is better for small or independent hotels?
Small hotels should prioritize ease of use and fast onboarding. N2Pricing by Revenue Analytics leads in ease of use at 5.0/5 vs 4.8/5. Look for transparent pricing and a trial or demo option. Filter reviews on each product page by property size to hear from hotels like yours.
Do happyhotel or N2Pricing by Revenue Analytics offer a free plan?
happyhotel: No. N2Pricing by Revenue Analytics: No. Neither product currently offers a free tier. Most Revenue Management Systems vendors offer demos or trials — request one from each to evaluate before committing.
How Does HTR Evaluate and Rank happyhotel and N2Pricing by Revenue Analytics?
The HT Score is a composite ranking that considers 4 criteria groups and over a dozen variables to help hoteliers objectively compare hotel technology products. happyhotel has an HT Score of 95 and Revenue Analytics has 76. Here is how the score is calculated.
| Criteria Group | Weight | What It Measures |
|---|---|---|
| Customer Ratings & Reviews |
|
How highly do users recommend this product? Ratings Score, Review Volume, Share of Voice, Review Depth, Review Recency, Success Stories ▾ The most heavily weighted factor. Analyzes average satisfaction ratings (likelihood to recommend, ease of use, support, ROI), total review count relative to category peers, review recency (at least 20 reviews in the trailing 6 months), and share of voice across unique hotel clients to detect selection bias. |
| Partner Ecosystem |
|
How highly do tech partners recommend this company? Partner Recommendations, Integration Quantity, Integration Quality ▾ Evaluates partner recommendations as expert votes of confidence, the number of verified integrations, and ecosystem quality — the average HT Scores of integration partners. Products with higher-quality integration ecosystems are more likely to deliver a connected tech stack. |
| Customer Centricity |
|
How customer-centric is this organization? Certified Support, Review Consistency, Profile Completeness ▾ Assesses whether the company has earned HTR Customer Support Certification, maintains consistent review collection over time (an indicator of feedback-driven culture), and keeps product profiles complete with capabilities, screenshots, pricing, and features. |
| Reach, Staying Power & Resources |
|
How extensive is this company's reach and resourcing? Geographic Reach, Staying Power, Company Resources, Trending Score ▾ Measures global presence (countries and regions served), years in business as a stability proxy, team headcount as a resource proxy, and a trending score based on trailing-twelve-month buyer inquiries, reviews, partner recommendations, and press activity. |
Customer ratings and reviews are by far the most important factor in the HT Score algorithm. HTR does not accept payment for higher rankings. All reviews are verified — only hotel industry practitioners with confirmed affiliations can submit ratings. View full HT Score methodology →
What Other Revenue Management Systems Comparisons Are Hoteliers Reading?
Explore more head-to-head comparisons based on verified hotelier reviews.






Get Your Free AI Analyst Report
Custom recommendations tailored to your property


Let´s lookup your hotel information
Still weighing your revenue management systems options?
A few popular systems from our revenue management systems guide — or let our AI score each one against your specific property in about two minutes.


